

The Economic Consequences of Homelessness in The US
The Economic Consequences of Homelessness in The US
The Economic Consequences of Homelessness in The US

You also want an ePaper? Increase the reach of your titles
YUMPU automatically turns print PDFs into web optimized ePapers that Google loves.
<strong>The</strong> 2017 Annual Homeless Assessment Report to Congress: Part 1<br />
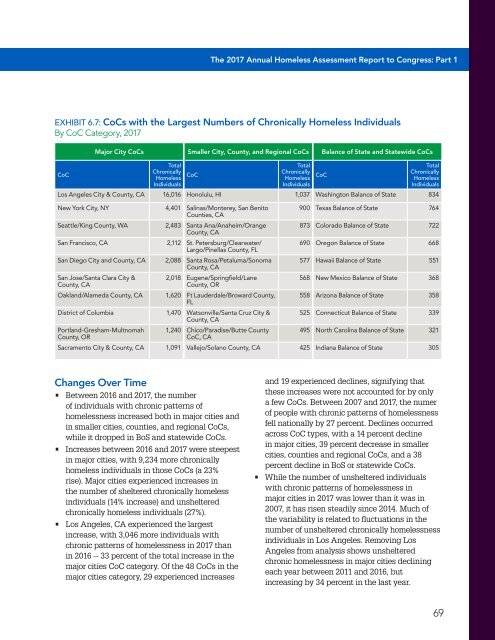
EXHIBIT 6.7: CoCs with the Largest Numbers <strong>of</strong> Chronically Homeless Individuals<br />
By CoC Category, 2017<br />
CoC<br />
Major City CoCs Smaller City, County, and Regional CoCs Balance <strong>of</strong> State and Statewide CoCs<br />
Total<br />
Chronically<br />
Homeless<br />
Individuals<br />
CoC<br />
Total<br />
Chronically<br />
Homeless<br />
Individuals<br />
CoC<br />
Total<br />
Chronically<br />
Homeless<br />
Individuals<br />
Los Angeles City & County, CA 16,016 Honolulu, HI 1,037 Wash<strong>in</strong>gton Balance <strong>of</strong> State 834<br />
New York City, NY 4,401 Sal<strong>in</strong>as/Monterey, San Benito<br />
Counties, CA<br />
Seattle/K<strong>in</strong>g County, WA 2,483 Santa Ana/Anaheim/Orange<br />
County, CA<br />
San Francisco, CA 2,112 St. Petersburg/Clearwater/<br />
Largo/P<strong>in</strong>ellas County, FL<br />
San Diego City and County, CA 2,088 Santa Rosa/Petaluma/Sonoma<br />
County, CA<br />
San Jose/Santa Clara City &<br />
County, CA<br />
2,018 Eugene/Spr<strong>in</strong>gfield/Lane<br />
County, OR<br />
Oakland/Alameda County, CA 1,620 Ft Lauderdale/Broward County,<br />
FL<br />
District <strong>of</strong> Columbia 1,470 Watsonville/Santa Cruz City &<br />
County, CA<br />
Portland-Gresham-Multnomah<br />
County, OR<br />
1,240 Chico/Paradise/Butte County<br />
CoC, CA<br />
900 Texas Balance <strong>of</strong> State 764<br />
873 Colorado Balance <strong>of</strong> State 722<br />
690 Oregon Balance <strong>of</strong> State 668<br />
577 Hawaii Balance <strong>of</strong> State 551<br />
568 New Mexico Balance <strong>of</strong> State 368<br />
558 Arizona Balance <strong>of</strong> State 358<br />
525 Connecticut Balance <strong>of</strong> State 339<br />
495 North Carol<strong>in</strong>a Balance <strong>of</strong> State 321<br />
Sacramento City & County, CA 1,091 Vallejo/Solano County, CA 425 Indiana Balance <strong>of</strong> State 305<br />
Changes Over Time<br />
• Between 2016 and 2017, the number<br />
<strong>of</strong> <strong>in</strong>dividuals with chronic patterns <strong>of</strong><br />
homelessness <strong>in</strong>creased both <strong>in</strong> major cities and<br />
<strong>in</strong> smaller cities, counties, and regional CoCs,<br />
while it dropped <strong>in</strong> BoS and statewide CoCs.<br />
• Increases between 2016 and 2017 were steepest<br />
<strong>in</strong> major cities, with 9,234 more chronically<br />
homeless <strong>in</strong>dividuals <strong>in</strong> those CoCs (a 23%<br />
rise). Major cities experienced <strong>in</strong>creases <strong>in</strong><br />
the number <strong>of</strong> sheltered chronically homeless<br />
<strong>in</strong>dividuals (14% <strong>in</strong>crease) and unsheltered<br />
chronically homeless <strong>in</strong>dividuals (27%).<br />
• Los Angeles, CA experienced the largest<br />
<strong>in</strong>crease, with 3,046 more <strong>in</strong>dividuals with<br />
chronic patterns <strong>of</strong> homelessness <strong>in</strong> 2017 than<br />
<strong>in</strong> 2016 -- 33 percent <strong>of</strong> the total <strong>in</strong>crease <strong>in</strong> the<br />
major cities CoC category. Of the 48 CoCs <strong>in</strong> the<br />
major cities category, 29 experienced <strong>in</strong>creases<br />
and 19 experienced decl<strong>in</strong>es, signify<strong>in</strong>g that<br />
these <strong>in</strong>creases were not accounted for by only<br />
a few CoCs. Between 2007 and 2017, the numer<br />
<strong>of</strong> people with chronic patterns <strong>of</strong> homelessness<br />
fell nationally by 27 percent. Decl<strong>in</strong>es occurred<br />
across CoC types, with a 14 percent decl<strong>in</strong>e<br />
<strong>in</strong> major cities, 39 percent decrease <strong>in</strong> smaller<br />
cities, counties and regional CoCs, and a 38<br />
percent decl<strong>in</strong>e <strong>in</strong> BoS or statewide CoCs.<br />
• While the number <strong>of</strong> unsheltered <strong>in</strong>dividuals<br />
with chronic patterns <strong>of</strong> homelessness <strong>in</strong><br />
major cities <strong>in</strong> 2017 was lower than it was <strong>in</strong><br />
2007, it has risen steadily s<strong>in</strong>ce 2014. Much <strong>of</strong><br />
the variability is related to fluctuations <strong>in</strong> the<br />
number <strong>of</strong> unsheltered chronically homelessness<br />
<strong>in</strong>dividuals <strong>in</strong> Los Angeles. Remov<strong>in</strong>g Los<br />
Angeles from analysis shows unsheltered<br />
chronic homelessness <strong>in</strong> major cities decl<strong>in</strong><strong>in</strong>g<br />
each year between 2011 and 2016, but<br />
<strong>in</strong>creas<strong>in</strong>g by 34 percent <strong>in</strong> the last year.<br />
69


