The Economic Consequences of Homelessness in The US
The Economic Consequences of Homelessness in The US
The Economic Consequences of Homelessness in The US
You also want an ePaper? Increase the reach of your titles
YUMPU automatically turns print PDFs into web optimized ePapers that Google loves.
7Inventory 1National Estimates <strong>of</strong> Beds<br />
<strong>in</strong> the United States<br />
<strong>Homelessness</strong> <strong>in</strong> the United States<br />
Data source: HIC 2007–2017<br />
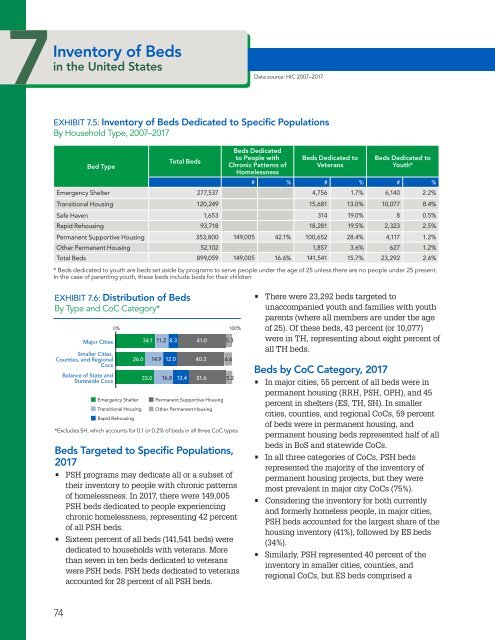
EXHIBIT 7.5: Inventory <strong>of</strong> Beds Dedicated to Specific Populations<br />
By Household Type, 2007–2017<br />
Bed Type<br />
Total Beds<br />
Beds Dedicated<br />
to People with<br />
Chronic Patterns <strong>of</strong><br />
<strong>Homelessness</strong><br />
Beds Dedicated to<br />
Veterans<br />
Beds Dedicated to<br />
Youth*<br />
# % # % # %<br />
Emergency Shelter 277,537 4,756 1.7% 6,140 2.2%<br />
Transitional Hous<strong>in</strong>g 120,249 15,681 13.0% 10,077 8.4%<br />
Safe Haven 1,653 314 19.0% 8 0.5%<br />
Rapid Rehous<strong>in</strong>g 93,718 18,281 19.5% 2,323 2.5%<br />
Permanent Supportive Hous<strong>in</strong>g 353,800 149,005 42.1% 100,652 28.4% 4,117 1.2%<br />
Other Permanent Hous<strong>in</strong>g 52,102 1,857 3.6% 627 1.2%<br />
Major Cities Total Beds 899,059 149,005 16.6% 141,541 15.7% 23,292 2.6%<br />
* Beds dedicated to youth are beds set aside by programs to serve people under the age <strong>of</strong> 25 unless there are no people under 25 present.<br />
ounties, and Regional CoCs In the case <strong>of</strong> parent<strong>in</strong>g youth, these beds <strong>in</strong>clude beds for their children<br />
f State and Statewide CoCs<br />
EXHIBIT 7.6: Distribution <strong>of</strong> Beds<br />
0 100<br />
By Type and CoC Category*<br />
Major Cities<br />
Smaller Cities,<br />
Counties, and Regional<br />
Cocs<br />
Balance <strong>of</strong> State and<br />
Statewide Cocs<br />
0% 100%<br />
26.0<br />
Emergency Shelter<br />
Transitional Hous<strong>in</strong>g<br />
Rapid Rehous<strong>in</strong>g<br />
34.1 11.2 8.3 41.0 5.3<br />
14.9<br />
12.0<br />
40.2<br />
33.0 16.8 13.4 31.6<br />
Permanent Supportive Hous<strong>in</strong>g<br />
Other Permanent Hous<strong>in</strong>g<br />
*Excludes SH, which accounts for 0.1 or 0.2% <strong>of</strong> beds <strong>in</strong> all three CoC types<br />
Beds Targeted to Specific Populations,<br />
2017<br />
• PSH programs may dedicate all or a subset <strong>of</strong><br />
their <strong>in</strong>ventory to people with chronic patterns<br />
<strong>of</strong> homelessness. In 2017, there were 149,005<br />
PSH beds dedicated to people experienc<strong>in</strong>g<br />
chronic homelessness, represent<strong>in</strong>g 42 percent<br />
<strong>of</strong> all PSH beds.<br />
• Sixteen percent <strong>of</strong> all beds (141,541 beds) were<br />
dedicated to households with veterans. More<br />
than seven <strong>in</strong> ten beds dedicated to veterans<br />
were PSH beds. PSH beds dedicated to veterans<br />
accounted for 28 percent <strong>of</strong> all PSH beds.<br />
6.6<br />
5.2<br />
• <strong>The</strong>re were 23,292 beds targeted to<br />
unaccompanied youth and families with youth<br />
parents (where all members are under the age<br />
<strong>of</strong> 25). Of these beds, 43 percent (or 10,077)<br />
were <strong>in</strong> TH, represent<strong>in</strong>g about eight percent <strong>of</strong><br />
all TH beds.<br />
Beds by CoC Category, 2017<br />
• In major cities, 55 percent <strong>of</strong> all beds were <strong>in</strong><br />
permanent hous<strong>in</strong>g (RRH, PSH, OPH), and 45<br />
percent <strong>in</strong> shelters (ES, TH, SH). In smaller<br />
cities, counties, and regional CoCs, 59 percent<br />
<strong>of</strong> beds were <strong>in</strong> permanent hous<strong>in</strong>g, and<br />
permanent hous<strong>in</strong>g beds represented half <strong>of</strong> all<br />
beds <strong>in</strong> BoS and statewide CoCs.<br />
• In all three categories <strong>of</strong> CoCs, PSH beds<br />
represented the majority <strong>of</strong> the <strong>in</strong>ventory <strong>of</strong><br />
permanent hous<strong>in</strong>g projects, but they were<br />
most prevalent <strong>in</strong> major city CoCs (75%).<br />
• Consider<strong>in</strong>g the <strong>in</strong>ventory for both currently<br />
and formerly homeless people, <strong>in</strong> major cities,<br />
PSH beds accounted for the largest share <strong>of</strong> the<br />
hous<strong>in</strong>g <strong>in</strong>ventory (41%), followed by ES beds<br />
(34%).<br />
• Similarly, PSH represented 40 percent <strong>of</strong> the<br />
<strong>in</strong>ventory <strong>in</strong> smaller cities, counties, and<br />
regional CoCs, but ES beds comprised a<br />
74


