

The Economic Consequences of Homelessness in The US
The Economic Consequences of Homelessness in The US
The Economic Consequences of Homelessness in The US

Create successful ePaper yourself
Turn your PDF publications into a flip-book with our unique Google optimized e-Paper software.
for at least 27 weeks—was 5.6 percent, 0.7 percentage po<strong>in</strong>t lower than the previous<br />
year’s figure.<br />
Follow<strong>in</strong>g are some highlights from the 2015 data:<br />
<br />
<br />
<br />
<br />
<br />
Full-time workers cont<strong>in</strong>ued to be much less likely to be among the work<strong>in</strong>g poor<br />
than were part-time workers. Among persons <strong>in</strong> the labor force for 27 weeks or<br />
more, 3.4 percent <strong>of</strong> those usually employed full time were classified as work<strong>in</strong>g<br />
poor, compared with 14.1 percent <strong>of</strong> part-time workers.<br />
Women were more likely than men to be among the work<strong>in</strong>g poor. In addition,<br />
Blacks and Hispanics cont<strong>in</strong>ued to be more than twice as likely as Whites and<br />
Asians to be among the work<strong>in</strong>g poor.<br />
<strong>The</strong> likelihood <strong>of</strong> be<strong>in</strong>g classified as work<strong>in</strong>g poor dim<strong>in</strong>ishes as workers atta<strong>in</strong><br />
higher levels <strong>of</strong> education. Among those with less than a high school diploma,<br />
16.2 percent <strong>of</strong> those who were <strong>in</strong> the labor force for at least 27 weeks were<br />
classified as work<strong>in</strong>g poor, compared with 1.7 percent <strong>of</strong> college graduates.<br />
Individuals who were employed <strong>in</strong> service occupations cont<strong>in</strong>ued to be more<br />
likely to be among the work<strong>in</strong>g poor than those employed <strong>in</strong> other major<br />
occupational groups.<br />
Among families with at least one member <strong>in</strong> the labor force for 27 weeks or more,<br />
those with children under 18 years old were about 5 times as likely as those<br />
without children to live <strong>in</strong> poverty. Families ma<strong>in</strong>ta<strong>in</strong>ed by women were almost<br />
twice as likely as families ma<strong>in</strong>ta<strong>in</strong>ed by men to be liv<strong>in</strong>g below the poverty level.<br />
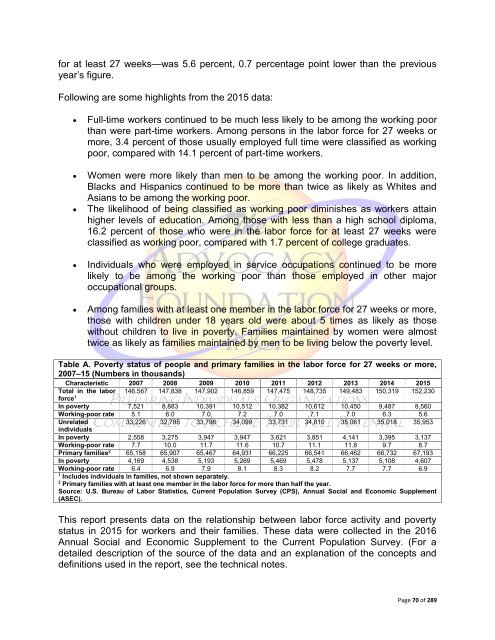
Table A. Poverty status <strong>of</strong> people and primary families <strong>in</strong> the labor force for 27 weeks or more,<br />
2007–15 (Numbers <strong>in</strong> thousands)<br />
Characteristic 2007 2008 2009 2010 2011 2012 2013 2014 2015<br />
Total <strong>in</strong> the labor 146,567 147,838 147,902 146,859 147,475 148,735 149,483 150,319 152,230<br />
force 1<br />
In poverty 7,521 8,883 10,391 10,512 10,382 10,612 10,450 9,487 8,560<br />
Work<strong>in</strong>g-poor rate 5.1 6.0 7.0 7.2 7.0 7.1 7.0 6.3 5.6<br />
Unrelated<br />
33,226 32,785 33,798 34,099 33,731 34,810 35,061 35,018 35,953<br />
<strong>in</strong>dividuals<br />
In poverty 2,558 3,275 3,947 3,947 3,621 3,851 4,141 3,395 3,137<br />
Work<strong>in</strong>g-poor rate 7.7 10.0 11.7 11.6 10.7 11.1 11.8 9.7 8.7<br />
Primary families 2 65,158 65,907 65,467 64,931 66,225 66,541 66,462 66,732 67,193<br />
In poverty 4,169 4,538 5,193 5,269 5,469 5,478 5,137 5,108 4,607<br />
Work<strong>in</strong>g-poor rate 6.4 6.9 7.9 8.1 8.3 8.2 7.7 7.7 6.9<br />
1<br />
Includes <strong>in</strong>dividuals <strong>in</strong> families, not shown separately.<br />
2<br />
Primary families with at least one member <strong>in</strong> the labor force for more than half the year.<br />
Source: U.S. Bureau <strong>of</strong> Labor Statistics, Current Population Survey (CPS), Annual Social and <strong>Economic</strong> Supplement<br />
(ASEC).<br />
This report presents data on the relationship between labor force activity and poverty<br />
status <strong>in</strong> 2015 for workers and their families. <strong>The</strong>se data were collected <strong>in</strong> the 2016<br />
Annual Social and <strong>Economic</strong> Supplement to the Current Population Survey. (For a<br />
detailed description <strong>of</strong> the source <strong>of</strong> the data and an explanation <strong>of</strong> the concepts and<br />
def<strong>in</strong>itions used <strong>in</strong> the report, see the technical notes.<br />
Page 70 <strong>of</strong> 289


