Okavango Delta Management Plan - Ramsar Convention on Wetlands
Okavango Delta Management Plan - Ramsar Convention on Wetlands
Okavango Delta Management Plan - Ramsar Convention on Wetlands
You also want an ePaper? Increase the reach of your titles
YUMPU automatically turns print PDFs into web optimized ePapers that Google loves.
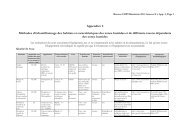
Table 2-15: Summary of the total direct use values derived from natural resources use in the<br />
study area (in Pula, 2005)<br />
Aggregate values<br />
(Pula)<br />
65<br />
Gross private<br />
value<br />
Net private value Cash Income Gross ec<strong>on</strong>omic<br />
output<br />
Gross value<br />
added<br />
Clay posts 151 416 149 492 - 158 987 157 833<br />
Upland grass 1 636 657 1 600 496 45 406 1 718 489 1 702 171<br />
Wetland grass 1 541 534 1 487 264 119 193 1 618 611 1 593 054<br />
Grass brooms 118 952 117 064 86 380 124 900 124 333<br />
Reeds 2 346 010 2 252 361 433 723 2 463 311 2 326 969<br />
Reed mats 6 999 6 776 3 181 7 349 7 290<br />
Reed fish gear 18 703 3 300 - 19 638 4 235<br />
Papyrus 24 851 16 6581 - 26 094 22 407<br />
Papyrus mats 106 154 105 531 46 626 111 461 111 297<br />
Palm leaves 1 792 090 1 787 837 5 331 1 881 695 1 878 505<br />
Palm products 1 513 400 1 508 336 1 345 705 1 589 070 1 587 731<br />
Wetland veg 43 579 43 579 12 756 45 758 45 758<br />
Wetland fruits 55 628 55 628 1 466 58 409 58 409<br />
Upland veg 1 084 129 1 084 129 117 700 1 138 335 1 138 335<br />
Upland fruits 221 755 221 755 77 372 232 842 232 842<br />
Fruits-based drinks 2 406 624 2 406 624 2 225 709 2 526 955 2 526 955<br />
Medicinal plants 281 882 277 730 55 322 295 976 291 616<br />
Firewood 8 822 904 8 581 022 787 548 9 264 049 8 911 897<br />
Poles and withies 1 794 388 1 681 222 21 329 1 884 108 1 727 193<br />
Timber 572 008 568 697 174 545 600 608 596 230<br />
Wood products 277 822 190 569 267 715 291 713 223 981<br />
Traditi<strong>on</strong>al fishing 726 079 657 883 70 661 762 382 759 349<br />
Modern fishing 2 315 803 2 007 637 1 310 092 2 431 593 2 399 054<br />
H<strong>on</strong>ey 1 264 1 031 - 1 327 1 083<br />
Wild animals 357 843 125 494 - 375 735 -305 469<br />
Upland birds 707 014 481 706 23 602 742 364 66 441<br />
Wetland birds 168 763 -51 601 58 685 177 201 -483 890<br />
Total Upland 18 434 658 17 487 031 3 882 628 19 356 388 17 395 441<br />
Total Wetland 10 659 593 9 881 189 3 407 419 11 192 572 10 310 168<br />
TOTAL 29 094 247 27 368 220 7 290 048 30 548 960 27 705 608<br />
Source: ODMP – Ec<strong>on</strong>omic Valuati<strong>on</strong> Report (2006)<br />
Table 2-16 summarizes the net private values associated with all household activities in the<br />
different z<strong>on</strong>es of the <str<strong>on</strong>g>Ramsar</str<strong>on</strong>g> site, and it also shows the proporti<strong>on</strong> of these values derived<br />
from the wetland. Overall, the <str<strong>on</strong>g>Delta</str<strong>on</strong>g> c<strong>on</strong>tributes 31% of the value gained from agriculture<br />
and natural resource use. It should be noted that there are also costs associated with the<br />
<str<strong>on</strong>g>Delta</str<strong>on</strong>g> that have not been quantified explicitly, but which are accounted for in the above<br />
values. These include the transmissi<strong>on</strong> of disease and predati<strong>on</strong> <strong>on</strong> livestock, and the loss<br />
of crops to wild animals (Barnes, 2006).


