Mainly on the Elbe River - Central Europe
Mainly on the Elbe River - Central Europe
Mainly on the Elbe River - Central Europe

You also want an ePaper? Increase the reach of your titles
YUMPU automatically turns print PDFs into web optimized ePapers that Google loves.
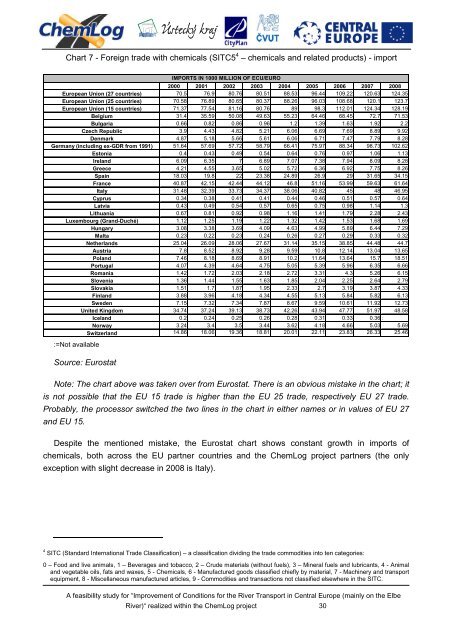
Chart 7 - Foreign trade with chemicals (SITC5 4 – chemicals and related products) - import<br />
2000 2001 2002 2003 2004 2005 2006 2007 2008<br />
<strong>Europe</strong>an Uni<strong>on</strong> (27 countries) 70.5 76.9 80.76 80.51 88.53 96.44 109.22 120.63 124.35<br />
<strong>Europe</strong>an Uni<strong>on</strong> (25 countries) 70.58 76.89 80.65 80.37 88.26 96.03 108.68 120.1 123.7<br />
<strong>Europe</strong>an Uni<strong>on</strong> (15 countries) 71.37 77.54 81.16 80.76 89 98.3 112.01 124.34 128.19<br />
Belgium 31.4 35.59 50.08 49.63 55.23 64.46 68.45 72.7 71.53<br />
Bulgaria 0.66 0.82 0.86 0.96 1.2 1.39 1.63 1.92 2.2<br />
Czech Republic 3.9 4.43 4.82 5.21 6.06 6.69 7.69 8.89 9.92<br />
Denmark 4.87 5.18 5.66 5.61 6.06 6.71 7.47 7.79 8.28<br />
Germany (including ex-GDR from 1991) 51.64 57.69 57.72 58.79 66.41 75.97 88.34 98.73 102.62<br />
Est<strong>on</strong>ia 0.4 0.43 0.49 0.54 0.64 0.76 0.97 1.06 1.13<br />
Ireland 6.09 6.35 7 6.89 7.07 7.38 7.94 8.09 8.28<br />
Greece 4.21 4.55 3.65 5.02 5.72 6.36 6.92 7.75 8.26<br />
Spain 18.03 19.8 22 23.38 24.89 26.9 29 31.65 34.15<br />
France 40.87 42.15 42.44 44.12 46.8 51.16 53.99 59.63 61.64<br />
Italy 31.48 32.39 33.73 34.37 38.06 40.82 45 48 46.95<br />
Cyprus 0.34 0.38 0.41 0.41 0.44 0.46 0.51 0.57 0.64<br />
Latvia 0.43 0.49 0.54 0.57 0.65 0.75 0.98 1.14 1.3<br />
Lithuania 0.67 0.81 0.92 0.98 1.16 1.41 1.79 2.28 2.43<br />
Luxembourg (Grand-Duché) 1.12 1.25 1.19 1.22 1.32 1.42 1.53 1.68 1.69<br />
Hungary 3.08 3.38 3.69 4.09 4.63 4.99 5.89 6.44 7.29<br />
Malta 0.23 0.22 0.23 0.24 0.26 0.27 0.29 0.33 0.32<br />
Ne<strong>the</strong>rlands 25.04 26.09 28.06 27.67 31.14 35.15 38.85 44.48 44.7<br />
Austria 7.8 8.52 8.92 9.28 9.59 10.8 12.14 13.04 13.65<br />
Poland 7.46 8.18 8.69 8.91 10.2 11.64 13.64 15.7 18.51<br />
Portugal 4.07 4.39 4.64 4.75 5.05 5.39 5.96 6.35 6.66<br />
Romania 1.42 1.72 2.03 2.18 2.72 3.31 4.3 5.26 6.15<br />
Slovenia 1.36 1.44 1.55 1.63 1.85 2.04 2.25 2.64 2.79<br />
Slovakia 1.51 1.7 1.87 1.95 2.33 2.7 3.19 3.87 4.33<br />
Finland 3.88 3.96 4.18 4.34 4.55 5.13 5.84 5.82 6.13<br />
Sweden 7.15 7.32 7.34 7.87 8.67 9.59 10.61 11.92 12.73<br />
United Kingdom 34.74 37.24 39.13 38.73 42.26 43.94 47.77 51.97 48.58<br />
Iceland 0.2 0.24 0.25 0.26 0.28 0.31 0.33 0.36 :<br />
Norway 3.24 3.4 3.5 3.44 3.62 4.18 4.66 5.03 5.69<br />
Switzerland 14.86 18.06 19.36 18.81 20.01 22.11 23.83 26.33 25.46<br />
:=Not available<br />
Source: Eurostat<br />
IMPORTS IN 1000 MILLION OF ECU/EURO<br />
Note: The chart above was taken over from Eurostat. There is an obvious mistake in <strong>the</strong> chart; it<br />
is not possible that <strong>the</strong> EU 15 trade is higher than <strong>the</strong> EU 25 trade, respectively EU 27 trade.<br />
Probably, <strong>the</strong> processor switched <strong>the</strong> two lines in <strong>the</strong> chart in ei<strong>the</strong>r names or in values of EU 27<br />
and EU 15.<br />
Despite <strong>the</strong> menti<strong>on</strong>ed mistake, <strong>the</strong> Eurostat chart shows c<strong>on</strong>stant growth in imports of<br />
chemicals, both across <strong>the</strong> EU partner countries and <strong>the</strong> ChemLog project partners (<strong>the</strong> <strong>on</strong>ly<br />
excepti<strong>on</strong> with slight decrease in 2008 is Italy).<br />
4 SITC (Standard Internati<strong>on</strong>al Trade Classificati<strong>on</strong>) – a classificati<strong>on</strong> dividing <strong>the</strong> trade commodities into ten categories:<br />
0 – Food and live animals, 1 – Beverages and tobacco, 2 – Crude materials (without fuels), 3 – Mineral fuels and lubricants, 4 - Animal<br />
and vegetable oils, fats and waxes, 5 - Chemicals, 6 - Manufactured goods classified chiefly by material, 7 - Machinery and transport<br />
equipment, 8 - Miscellaneous manufactured articles, 9 - Commodities and transacti<strong>on</strong>s not classified elsewhere in <strong>the</strong> SITC.<br />
A feasibility study for “Improvement of C<strong>on</strong>diti<strong>on</strong>s for <strong>the</strong> <strong>River</strong> Transport in <strong>Central</strong> <strong>Europe</strong> (mainly <strong>on</strong> <strong>the</strong> <strong>Elbe</strong><br />
<strong>River</strong>)“ realized within <strong>the</strong> ChemLog project 30