Proceedings of the 10th International Colloquium on Paratuberculosis
Proceedings of the 10th International Colloquium on Paratuberculosis
Proceedings of the 10th International Colloquium on Paratuberculosis

You also want an ePaper? Increase the reach of your titles
YUMPU automatically turns print PDFs into web optimized ePapers that Google loves.
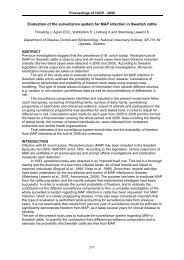
Latium Regi<strong>on</strong> Viterbo districts<br />
RESULTS<br />
At animal level <str<strong>on</strong>g>the</str<strong>on</strong>g> AP was in <str<strong>on</strong>g>the</str<strong>on</strong>g> range 1.6 -4.3 % with a total prevalence <str<strong>on</strong>g>of</str<strong>on</strong>g> 3%. The TP was<br />
in <str<strong>on</strong>g>the</str<strong>on</strong>g> range 0.26 -7.3 % with a total prevalence <str<strong>on</strong>g>of</str<strong>on</strong>g> 3.9% . Am<strong>on</strong>g <str<strong>on</strong>g>the</str<strong>on</strong>g> flocks <str<strong>on</strong>g>the</str<strong>on</strong>g> HAP was<br />
from 20% to 50% and <str<strong>on</strong>g>the</str<strong>on</strong>g> HTP was from 0% to 72%. The results <str<strong>on</strong>g>of</str<strong>on</strong>g> herd prevalence are<br />
influenced from <str<strong>on</strong>g>the</str<strong>on</strong>g> low sensitivity <str<strong>on</strong>g>of</str<strong>on</strong>g> <str<strong>on</strong>g>the</str<strong>on</strong>g> test.<br />
We calculated also <str<strong>on</strong>g>the</str<strong>on</strong>g> c<strong>on</strong>fidence interval (CI). Instead <str<strong>on</strong>g>of</str<strong>on</strong>g> estimating <str<strong>on</strong>g>the</str<strong>on</strong>g> parameter by<br />
a single value, an interval likely to include <str<strong>on</strong>g>the</str<strong>on</strong>g> parameter is given. Thus, c<strong>on</strong>fidence intervals<br />
are used to indicate <str<strong>on</strong>g>the</str<strong>on</strong>g> reliability <str<strong>on</strong>g>of</str<strong>on</strong>g> an estimate.<br />
Minimum requirements<br />
(according to Nielsen and T<str<strong>on</strong>g>of</str<strong>on</strong>g>t,<br />
2009)<br />
LATIUM<br />
regi<strong>on</strong><br />
Viterbo Rieti<br />
ROMA<br />
Latina<br />
Our data<br />
Regi<strong>on</strong> and country Lazio /Viterbo, Italy<br />
Year <str<strong>on</strong>g>of</str<strong>on</strong>g> study 2005<br />
Animal species Sheep<br />
Test used ELISA Pourquier<br />
Age >1 year<br />
Number <str<strong>on</strong>g>of</str<strong>on</strong>g> animals studied 1500<br />
Number <str<strong>on</strong>g>of</str<strong>on</strong>g> herds studied 50<br />
Number <str<strong>on</strong>g>of</str<strong>on</strong>g> animals positive 45<br />
Number <str<strong>on</strong>g>of</str<strong>on</strong>g> herds positive 20<br />
Sampling strategy 50 sheep flocks, randomly selected and proporti<strong>on</strong>ally<br />
allocated according to <str<strong>on</strong>g>the</str<strong>on</strong>g> 5 sanitary districts <str<strong>on</strong>g>of</str<strong>on</strong>g> <str<strong>on</strong>g>the</str<strong>on</strong>g> Viterbo<br />
province<br />
Animal prevalence<br />
District Animals<br />
tested (n)<br />
Frosin<strong>on</strong>e<br />
ELISA<br />
positive<br />
Prevalence<br />
(AP)%<br />
AP 95%<br />
k<strong>on</strong>fidence<br />
interval<br />
TP%<br />
Vt1 300 13 4.3 2-6.5 7.3<br />
Vt2 300 7 2.3 0.6-4 2.1<br />
Vt3 300 10 3.8 1.6-6 6<br />
Vt4 300 10 3.8 1.6-6 6<br />
Vt5 300 5 1.6 0.19-3 0.26<br />
Total 1500 45 3 2.1-3.8 3.9<br />
181