Proceedings of the 10th International Colloquium on Paratuberculosis
Proceedings of the 10th International Colloquium on Paratuberculosis
Proceedings of the 10th International Colloquium on Paratuberculosis

Create successful ePaper yourself
Turn your PDF publications into a flip-book with our unique Google optimized e-Paper software.
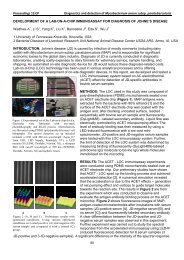
A statistically significant lower frequency in MAP infecti<strong>on</strong> was observed in animals<br />
older than 5 years compared to 3-5 years-old animals (pELISA=0.0002; pCULTURE=0.0087; pRTi-<br />
PCR=0.0078; pHP< 0.0001).<br />
A. B.<br />
NUMBER OF SAMPLES (n)<br />
140<br />
120<br />
100<br />
80<br />
60<br />
40<br />
20<br />
0<br />
25.0<br />
10.4<br />
16.5<br />
10.8<br />
5.9<br />
3.0<br />
4.0<br />
7.4<br />
11.1<br />
1,5-2 2-3 3-4 4-5 5-6 6-7 7-8 8-9 9-10 10-11 >11<br />
AGE (YEARS)<br />
C. D.<br />
NUMBER OF SAMPLES (n)<br />
140<br />
120<br />
100<br />
80<br />
60<br />
40<br />
20<br />
0<br />
25.0<br />
18.7<br />
26.8<br />
25.0<br />
18.8<br />
13.4<br />
10.9<br />
12.0<br />
22.2<br />
11.1<br />
26.3<br />
1,5-2 2-3 3-4 4-5 5-6 6-7 7-8 8-9 9-10 10-11 >11<br />
AGE (YEARS)<br />
45<br />
40<br />
35<br />
30<br />
25<br />
20<br />
15<br />
10<br />
5<br />
0<br />
45<br />
40<br />
35<br />
30<br />
25<br />
20<br />
15<br />
10<br />
5<br />
0<br />
PTB PREVALENCE (%) .<br />
PTB PREVALENCE (%) .<br />
NUMBER OF SAMPLES (n)<br />
140<br />
120<br />
100<br />
80<br />
60<br />
40<br />
20<br />
0<br />
140<br />
120<br />
100<br />
80<br />
60<br />
40<br />
20<br />
0<br />
25.0<br />
18.7<br />
27.1<br />
21.8<br />
18.8<br />
8.9 9.1<br />
12.0<br />
23.1<br />
16.7<br />
23.5<br />
1,5-2 2-3 3-4 4-5 5-6 6-7 7-8 8-9 9-10 10-11 >11<br />
33.3<br />
18.7<br />
42.3<br />
25.0<br />
AGE (YEARS)<br />
6.1<br />
4.0<br />
14.3<br />
1,5-2 2-3 3-4 4-5 5-6 6-7 7-8 8-9 9-10 10-11 >11<br />
AGE (YEARS)<br />
Fig. 1. Age structure <str<strong>on</strong>g>of</str<strong>on</strong>g> MAP infecti<strong>on</strong> in relati<strong>on</strong> to diagnostic tests: ELISA (A), culture (B),<br />
RTi-PCR (C) and histopathological examinati<strong>on</strong> (D). Line: MAP prevalence and bars: number<br />
<str<strong>on</strong>g>of</str<strong>on</strong>g> samples tested.<br />
Table 1. Sensitivity, complementary sensitivity and agreement (�) values <str<strong>on</strong>g>of</str<strong>on</strong>g> diagnostic test<br />
combinati<strong>on</strong>s. Interpretati<strong>on</strong> <str<strong>on</strong>g>of</str<strong>on</strong>g> agreement: poor (�=0.00-0.20), fair (�=0.21-0.40), moderate<br />
(�=0.41-0.60), good (�=0.61-0.80) and excellent (�=0.81-1.00).<br />
Sensitivity (%) Complementary sensitivity (%)<br />
EVALUATED<br />
REFERENCE TEST<br />
REFERENCE TEST<br />
TEST ELISA CULTURE RTi-PCR HP ELISA CULTURE RTi-PCR HP<br />
ELISA<br />
CULTURE<br />
RTi-PCR<br />
NUMBER OF SAMPLES (n)<br />
- 37.0 37.1 72.4 - 6.5 4.3 24.1<br />
(�=0.454) (�=0.461) (�=0.696)<br />
85.1 - 63.4 85.7 144.7 - 33.0 92.9<br />
(�=0.562) (�=0.536)<br />
89.6 65.7 - 86.2 152.0 38.0 - 96.5<br />
(�=0.525)<br />
HP 75.0 48.0 47.2 - 28.6 8.0 7.5 -<br />
Broadly, diagnostic test combinati<strong>on</strong>s resulted in moderate agreement (�=0.41-0.60)<br />
excepting for <str<strong>on</strong>g>the</str<strong>on</strong>g> combinati<strong>on</strong> ELISA and histopathological examinati<strong>on</strong> that showed a good<br />
187<br />
45<br />
40<br />
35<br />
30<br />
25<br />
20<br />
15<br />
10<br />
5<br />
0<br />
45<br />
40<br />
35<br />
30<br />
25<br />
20<br />
15<br />
10<br />
5<br />
0<br />
PTB PREVALENCE (%) .<br />
PTB PREVALENCE (%) .