Proceedings of the 10th International Colloquium on Paratuberculosis
Proceedings of the 10th International Colloquium on Paratuberculosis
Proceedings of the 10th International Colloquium on Paratuberculosis

You also want an ePaper? Increase the reach of your titles
YUMPU automatically turns print PDFs into web optimized ePapers that Google loves.
(MAA) (MAP87 and MAP3776) and 1 from an immunological hot spot regi<strong>on</strong> (MAP3783).<br />
Following overnight culture, <str<strong>on</strong>g>the</str<strong>on</strong>g> culture plates were centrifuged and <str<strong>on</strong>g>the</str<strong>on</strong>g> supernatants<br />
collected and stored at -20ºC until fur<str<strong>on</strong>g>the</str<strong>on</strong>g>r analysis. The antigen specific IFN-� producti<strong>on</strong> in<br />
supernatants were determined by an in-house ELISA as described elsewhere (Mikkelsen et<br />
al., 2009). The level <str<strong>on</strong>g>of</str<strong>on</strong>g> IFN-� (pg/ml) was calculated using linear regressi<strong>on</strong> <strong>on</strong> log-log<br />
transformed readings from <str<strong>on</strong>g>the</str<strong>on</strong>g> two-fold diluti<strong>on</strong> series <str<strong>on</strong>g>of</str<strong>on</strong>g> a reference standard with known IFN-�<br />
c<strong>on</strong>centrati<strong>on</strong>.<br />
Samples were excluded if <str<strong>on</strong>g>the</str<strong>on</strong>g> IFN-� value in <str<strong>on</strong>g>the</str<strong>on</strong>g> SEB-stimulated sample was below 1500<br />
pg/ml or <str<strong>on</strong>g>the</str<strong>on</strong>g> PBS-stimulated sample was higher than 250 pg/ml. Based <strong>on</strong> <str<strong>on</strong>g>the</str<strong>on</strong>g>se exclusi<strong>on</strong> criteria,<br />
<strong>on</strong>e heifer was excluded at first and sec<strong>on</strong>d sampling and two heifers were excluded at <str<strong>on</strong>g>the</str<strong>on</strong>g> third<br />
sampling. To determine <str<strong>on</strong>g>the</str<strong>on</strong>g> cut-<str<strong>on</strong>g>of</str<strong>on</strong>g>f for each <str<strong>on</strong>g>of</str<strong>on</strong>g> <str<strong>on</strong>g>the</str<strong>on</strong>g> 14 novel antigens and PPDj, blood<br />
samples were collected from 60 heifers 15-24 m<strong>on</strong>ths <str<strong>on</strong>g>of</str<strong>on</strong>g> age from a n<strong>on</strong>-infected herd.<br />
Samples from <str<strong>on</strong>g>the</str<strong>on</strong>g> n<strong>on</strong>-infected herd heifer were excluded, if <str<strong>on</strong>g>the</str<strong>on</strong>g> IFN-� value in SEB-stimulated<br />
sample was below 1500 pg/ml or <str<strong>on</strong>g>the</str<strong>on</strong>g> PBS-stimulated sample was higher than 75 pg/ml. The<br />
remaining samples were used to calculate <str<strong>on</strong>g>the</str<strong>on</strong>g> cut-<str<strong>on</strong>g>of</str<strong>on</strong>g>f for each antigen. The cut-<str<strong>on</strong>g>of</str<strong>on</strong>g>f for each<br />
antigen was calculated as: mean IFN-� resp<strong>on</strong>se + (1.96 � standard deviati<strong>on</strong> <str<strong>on</strong>g>of</str<strong>on</strong>g> IFN-� resp<strong>on</strong>se).<br />
RESULTS<br />
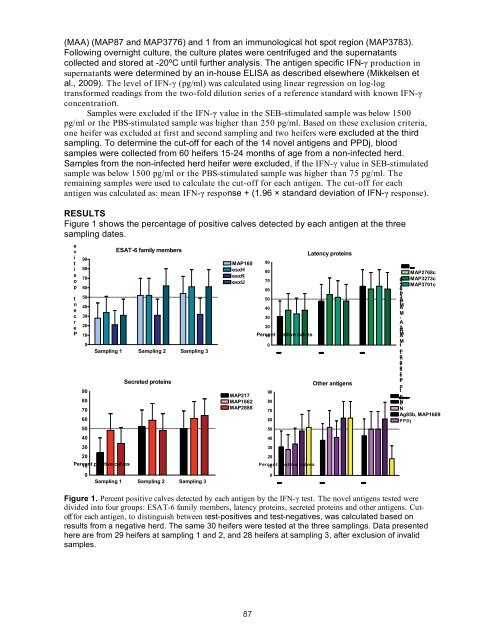
Figure 1 shows <str<strong>on</strong>g>the</str<strong>on</strong>g> percentage <str<strong>on</strong>g>of</str<strong>on</strong>g> positive calves detected by each antigen at <str<strong>on</strong>g>the</str<strong>on</strong>g> three<br />
sampling dates.<br />
e<br />
v<br />
i<br />
t<br />
i<br />
s<br />
o<br />
p<br />
t<br />
n<br />
e<br />
c<br />
r<br />
e<br />
P<br />
90<br />
80<br />
70<br />
60<br />
50<br />
40<br />
30<br />
20<br />
10<br />
0<br />
90<br />
80<br />
70<br />
60<br />
50<br />
40<br />
30<br />
0<br />
ESAT-6 family members<br />
Sampling 1 Sampling 2 Sampling 3<br />
20<br />
Percent 10 positive calves<br />
Secreted proteins<br />
Sampling 1 Sampling 2 Sampling 3<br />
MAP160<br />
esxH<br />
esxK<br />
esxU<br />
MAP217<br />
MAP1662<br />
MAP2888<br />
90<br />
80<br />
70<br />
60<br />
50<br />
40<br />
30<br />
20<br />
Percent 10 positive calves<br />
0<br />
90<br />
80<br />
70<br />
60<br />
50<br />
40<br />
30<br />
20<br />
0<br />
Latency proteins<br />
Sampling 1 Sampling 2 Sampling 3<br />
Percent 10 positive calves<br />
O<str<strong>on</strong>g>the</str<strong>on</strong>g>r antigens<br />
Sampling 1 Sampling 2 Sampling 3<br />
MAP2487c<br />
MAP2768c<br />
6 MAP3273c<br />
7 MAP3701c<br />
8<br />
7<br />
P<br />
3<br />
A<br />
P<br />
M<br />
A<br />
M<br />
,<br />
A<br />
,<br />
A<br />
MA<br />
M<br />
t<br />
nt<br />
en<br />
se<br />
e s<br />
re<br />
pr<br />
p<br />
t<br />
oImm<br />
hot spot, MAP3783 t<br />
No<br />
N<br />
Ag85b, MAP1609<br />
PPDj<br />
Figure 1. Percent positive calves detected by each antigen by <str<strong>on</strong>g>the</str<strong>on</strong>g> IFN-� test. The novel antigens tested were<br />
divided into four groups: ESAT-6 family members, latency proteins, secreted proteins and o<str<strong>on</strong>g>the</str<strong>on</strong>g>r antigens. Cut<str<strong>on</strong>g>of</str<strong>on</strong>g>f<br />
for each antigen, to distinguish between test-positives and test-negatives, was calculated based <strong>on</strong><br />
results from a negative herd. The same 30 heifers were tested at <str<strong>on</strong>g>the</str<strong>on</strong>g> three samplings. Data presented<br />
here are from 29 heifers at sampling 1 and 2, and 28 heifers at sampling 3, after exclusi<strong>on</strong> <str<strong>on</strong>g>of</str<strong>on</strong>g> invalid<br />
samples.<br />
87<br />
2