Proceedings of the 10th International Colloquium on Paratuberculosis
Proceedings of the 10th International Colloquium on Paratuberculosis
Proceedings of the 10th International Colloquium on Paratuberculosis

Create successful ePaper yourself
Turn your PDF publications into a flip-book with our unique Google optimized e-Paper software.
Table 1 UK and Cyprus MAP survey Results<br />
Survey<br />
Total<br />
Samples<br />
Phage Assay Phage - PCR Culture<br />
No. Pos. % No. Pos. % No. Pos. %<br />
UK 54 54 19 35.2 54 1 1.9 54 0 0<br />
Cyprus 225 225 218 96.9 225 50 22.2 225 2 0.9<br />
The TVC results (Table 2) are separated into groups according to microbial load. No relati<strong>on</strong>ship<br />
was seen between <str<strong>on</strong>g>the</str<strong>on</strong>g> TVC and samples being phage-PCR MAP positive. This c<strong>on</strong>firms that<br />
<str<strong>on</strong>g>the</str<strong>on</strong>g> MAP were not being introduced into <str<strong>on</strong>g>the</str<strong>on</strong>g> milk by faecal c<strong>on</strong>taminati<strong>on</strong> and that in <str<strong>on</strong>g>the</str<strong>on</strong>g> Cypriot<br />
study we can deduce that MAP is being shed into <str<strong>on</strong>g>the</str<strong>on</strong>g> milk by animals that do not display any<br />
clinical symptoms <str<strong>on</strong>g>of</str<strong>on</strong>g> <str<strong>on</strong>g>the</str<strong>on</strong>g> disease (clinical herd data was not available for <str<strong>on</strong>g>the</str<strong>on</strong>g> UK samples).<br />
Characterizati<strong>on</strong> <str<strong>on</strong>g>of</str<strong>on</strong>g> <str<strong>on</strong>g>the</str<strong>on</strong>g> 2 culture isolates identified <strong>on</strong>e as an S strain and <str<strong>on</strong>g>the</str<strong>on</strong>g> o<str<strong>on</strong>g>the</str<strong>on</strong>g>r as a C strain.<br />
The presence <str<strong>on</strong>g>of</str<strong>on</strong>g> <str<strong>on</strong>g>the</str<strong>on</strong>g> S strain in <str<strong>on</strong>g>the</str<strong>on</strong>g> cattle herd populati<strong>on</strong> is interesting from an epidemiological<br />
perspective since <str<strong>on</strong>g>the</str<strong>on</strong>g> presence <str<strong>on</strong>g>of</str<strong>on</strong>g> this strain has also been found in <str<strong>on</strong>g>the</str<strong>on</strong>g> Cypriot sheep and goat<br />
populati<strong>on</strong>s (Liapi et al., 2009). The extended culture times required to isolate this organism<br />
may explain why it was not previously cultured from bovine milk samples.<br />
Table 2 MAP and Viable Count Results<br />
Total Viable Count Data Phage Positive samples IS900-PCR positive samples<br />
Survey �<br />
Log4<br />
cfu/ml<br />
Log4-<br />
Log5<br />
cfu/ml<br />
>Log5.0<br />
1 cfu/ml<br />
�Log4<br />
cfu/ml<br />
Log4-<br />
Log5<br />
cfu/ml<br />
>Log5.01<br />
cfu/ml<br />
�Log4<br />
cfu/ml<br />
Log4-<br />
Log5<br />
cfu/ml<br />
>Log5.01<br />
cfu/ml<br />
UK<br />
21<br />
7<br />
26<br />
15<br />
Cyprus 105 95 25 102 93 23 25 21 4<br />
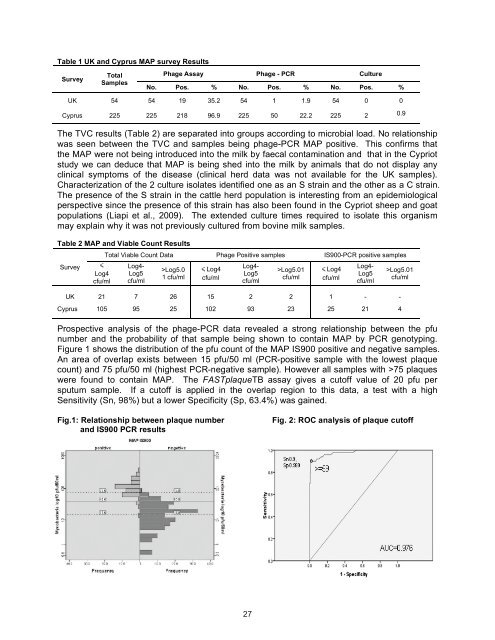
Prospective analysis <str<strong>on</strong>g>of</str<strong>on</strong>g> <str<strong>on</strong>g>the</str<strong>on</strong>g> phage-PCR data revealed a str<strong>on</strong>g relati<strong>on</strong>ship between <str<strong>on</strong>g>the</str<strong>on</strong>g> pfu<br />
number and <str<strong>on</strong>g>the</str<strong>on</strong>g> probability <str<strong>on</strong>g>of</str<strong>on</strong>g> that sample being shown to c<strong>on</strong>tain MAP by PCR genotyping.<br />
Figure 1 shows <str<strong>on</strong>g>the</str<strong>on</strong>g> distributi<strong>on</strong> <str<strong>on</strong>g>of</str<strong>on</strong>g> <str<strong>on</strong>g>the</str<strong>on</strong>g> pfu count <str<strong>on</strong>g>of</str<strong>on</strong>g> <str<strong>on</strong>g>the</str<strong>on</strong>g> MAP IS900 positive and negative samples.<br />
An area <str<strong>on</strong>g>of</str<strong>on</strong>g> overlap exists between 15 pfu/50 ml (PCR-positive sample with <str<strong>on</strong>g>the</str<strong>on</strong>g> lowest plaque<br />
count) and 75 pfu/50 ml (highest PCR-negative sample). However all samples with >75 plaques<br />
were found to c<strong>on</strong>tain MAP. The FASTplaqueTB assay gives a cut<str<strong>on</strong>g>of</str<strong>on</strong>g>f value <str<strong>on</strong>g>of</str<strong>on</strong>g> 20 pfu per<br />
sputum sample. If a cut<str<strong>on</strong>g>of</str<strong>on</strong>g>f is applied in <str<strong>on</strong>g>the</str<strong>on</strong>g> overlap regi<strong>on</strong> to this data, a test with a high<br />
Sensitivity (Sn, 98%) but a lower Specificity (Sp, 63.4%) was gained.<br />
Fig.1: Relati<strong>on</strong>ship between plaque number Fig. 2: ROC analysis <str<strong>on</strong>g>of</str<strong>on</strong>g> plaque cut<str<strong>on</strong>g>of</str<strong>on</strong>g>f<br />
and IS900 PCR results<br />
2<br />
27<br />
2<br />
1<br />
-<br />
-