- Page 2 and 3:
The MBR Book
- Page 4 and 5:
The MBR Book: Principles and Applic
- Page 6 and 7:
Contents Preface ix Contributors xi
- Page 8 and 9:
Contents vii 4.2.5 The Industrial T
- Page 10 and 11:
Preface What’s In and What’s No
- Page 12 and 13:
Term Meaning Common units MLD Megal
- Page 14 and 15:
Contributors A number of individual
- Page 16 and 17:
Contributor(s) Association/Organisa
- Page 18 and 19:
Introduction With acknowledgements
- Page 20 and 21:
such as the filtration market, tech
- Page 22 and 23:
D R IVE R S R EST R AI N TS Bathing
- Page 24 and 25:
Introduction 7 Much of the legislat
- Page 26 and 27:
of non-point source pollution contr
- Page 28 and 29:
exploitation index (WEI), the value
- Page 30 and 31:
1 500 000 1 250 000 1 000 000 750 0
- Page 32 and 33:
Alternative immersed FS and HF memb
- Page 34 and 35:
1.6 Conclusions Whilst the most sig
- Page 36 and 37:
Introduction 19 USEPA (2006b) www.e
- Page 38 and 39:
Fundamentals With acknowledgements
- Page 40 and 41:
they can be put, which then provide
- Page 42 and 43:
3µm (a) (b) membrane is chemically
- Page 44 and 45:
Table 2.2 Membrane configurations C
- Page 46 and 47:
2.1.4 Membrane process operation 2.
- Page 48 and 49:
only pseudo-steady-state (or stabil
- Page 50 and 51:
P max P dP/dt backwash cycle t b Ba
- Page 52 and 53:
Fundamentals 35 2.1.4.6 Critical fl
- Page 54 and 55:
neo-exponential increase at fluxes
- Page 56 and 57:
Screened raw sewage biologically ar
- Page 58 and 59:
Table 2.4 Microbial metabolism type
- Page 60 and 61:
which affords the operator complete
- Page 62 and 63:
Cumulative %ile undersize 1 0.8 0.6
- Page 64 and 65:
occurs from the surrounding air to
- Page 66 and 67:
(Madoni et al., 1993). The inter-re
- Page 68 and 69:
Viscosity (mPa s) 100 10 1 Viscosit
- Page 70 and 71:
on discharged P levels have been im
- Page 72 and 73:
Membrane process mode Diffusion Ext
- Page 74 and 75:
energy demand in kWh/m 3 permeate p
- Page 76 and 77:
Table 2.5 System facets of denitrif
- Page 78 and 79:
Fundamentals 61 Moreover, the poten
- Page 80 and 81:
iomass. There are also issues with
- Page 82 and 83:
Table 2.6 Effect of pore size on MB
- Page 84 and 85:
Fundamentals 67 fouling to be influ
- Page 86 and 87:
Fundamentals 69 fouling (i.e. membr
- Page 88 and 89:
2.3.6 Feed and biomass characterist
- Page 90 and 91:
Fouling relative distribution (%) 1
- Page 92 and 93:
has been proposed by Cho and co-wor
- Page 94 and 95:
Fundamentals 77 in the influent. Ab
- Page 96 and 97:
MLSS sample Centrifugation 5 min 50
- Page 98 and 99:
Table 2.11 Concentration of SMP com
- Page 100 and 101:
Fundamentals 83 correlation of MBR
- Page 102 and 103:
(Cui et al., 2003) by inducing liqu
- Page 104 and 105: Fundamentals 87 air cannot be used
- Page 106 and 107: Table 2.12 Dynamic effects Determin
- Page 108 and 109: Fundamentals 91 Table 2.13 Sub-crit
- Page 110 and 111: Fundamentals 93 sludge (Cho and Fan
- Page 112 and 113: Fundamentals 95 2.3.9.2 Employing a
- Page 114 and 115: Fundamentals 97 Whilst ultrasonic c
- Page 116 and 117: and immersed hybrid PAC-MBR (Kim an
- Page 118 and 119: Lastly, the vast majority of all st
- Page 120 and 121: Fundamentals 103 Brookes, A., Judd,
- Page 122 and 123: Fundamentals 105 Côté, P., Buisso
- Page 124 and 125: Fundamentals 107 Fuchs, W., Schatzm
- Page 126 and 127: Fundamentals 109 Howell, J.A., Chua
- Page 128 and 129: Fundamentals 111 Krauth, K. and Sta
- Page 130 and 131: Fundamentals 113 Liu, R., Huang, X.
- Page 132 and 133: Fundamentals 115 Nielson, P.H. and
- Page 134 and 135: Fundamentals 117 Sato, T. and Ishii
- Page 136 and 137: Fundamentals 119 Van Lier, J.B. (19
- Page 138 and 139: Fundamentals 121 Zhang, Y., Bu, D.,
- Page 140 and 141: Design With acknowledgements to: Ch
- Page 142 and 143: Other contributions to pumping ener
- Page 144 and 145: where J c is the cleaning flux. Fro
- Page 146 and 147: Table 3.1 Main features of aeration
- Page 148 and 149: Table 3.2 Biological operating para
- Page 150 and 151: Table 3.3 Physical operating parame
- Page 152 and 153: Table 3.4 Comparative pilot plant t
- Page 156 and 157: Table 3.8 Feedwater quality, PLWTP
- Page 158 and 159: Table 3.11 Cleaning protocols for t
- Page 160 and 161: Figure 3.1 The planned location of
- Page 162 and 163: Table 3.14 O&M data, Pietramurata W
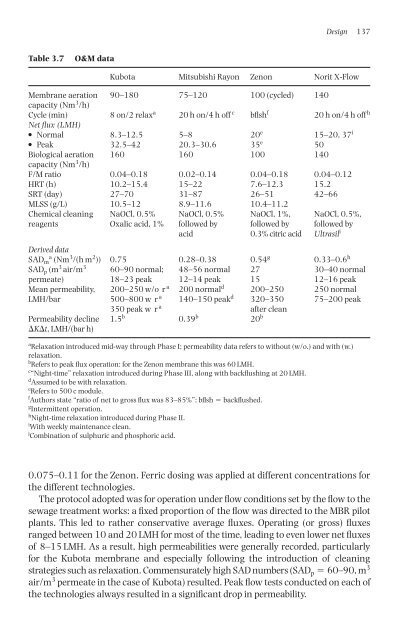
- Page 164 and 165: Design 147 Table 3.17 Design inform
- Page 166 and 167: Maintenance CIP was conducted throu
- Page 168 and 169: Permeability, LMH/bar 800 700 600 5
- Page 170 and 171: Table 3.22 Summary of pilot plant p
- Page 172 and 173: Table 3.25 Feedwater specification
- Page 174 and 175: Table 3.34 Aeration design Paramete
- Page 176 and 177: In short, the design calculation de
- Page 178 and 179: complications arise when estimating
- Page 180 and 181: Chapter 4 Commercial Technologies W
- Page 182 and 183: 4.1 Introduction Available and deve
- Page 184 and 185: Commercial technologies 167 suction
- Page 186 and 187: synonymous with R V Equation (3.13)
- Page 188 and 189: (a) (b) Figure 4.8 The Huber VRM ®
- Page 190 and 191: and is very robust. However, the la
- Page 192 and 193: Commercial technologies 175 (a) (b)
- Page 194 and 195: (a) (b) (c) Commercial technologies
- Page 196 and 197: Other equipment 1.11% Process air b
- Page 198 and 199: Thus far, almost all of the install
- Page 200 and 201: Figure 4.22 A rack of Memcor B10R m
- Page 202 and 203: Tensile elongation retention (%) 10
- Page 204 and 205:
Figure 4.28 Pilot plant at Mooka Co
- Page 206 and 207:
at 10 000-12 000 mg/L. The membrane
- Page 208 and 209:
4m 4m 1m Commercial technologies 19
- Page 210 and 211:
Figure 4.36 Ejector aerator Commerc
- Page 212 and 213:
Denitrification Nitrification Waste
- Page 214 and 215:
modules, with pore sizes ranging fr
- Page 216 and 217:
(a) (b) Figure 4.46 (a) Han-S Envir
- Page 218 and 219:
aerobic counterpart. This may be pa
- Page 220 and 221:
of the particularly large-diameter
- Page 222 and 223:
(c) air channelling, the risk of wh
- Page 224 and 225:
Case Studies With acknowledgements
- Page 226 and 227:
5.1 Introduction Membrane Bioreacto
- Page 228 and 229:
Case studies 211 Table 5.1 Comparis
- Page 230 and 231:
Case studies 213 0.6 m 3 per unit.
- Page 232 and 233:
Case studies 215 area of 15 840 m 2
- Page 234 and 235:
Aeration tank 1 FBDA FBDA 32 x J200
- Page 236 and 237:
Case studies 219 In this UNR config
- Page 238 and 239:
Table 5.6 Design criteria, Running
- Page 240 and 241:
Works inlet Inlet works Storm tank
- Page 242 and 243:
Case studies 225 to be treated to a
- Page 244 and 245:
Case studies 227 membranes, assembl
- Page 246 and 247:
Figure 5.16 A Naston package plant
- Page 248 and 249:
Air Influent DN N M Figure 5.18 The
- Page 250 and 251:
Table 5.9 Toray membrane-based MBR
- Page 252 and 253:
Figure 5.23 Aeration tank and cover
- Page 254 and 255:
Figure 5.24 The original plant at B
- Page 256 and 257:
Main permeate header Permeate pump
- Page 258 and 259:
Case studies 241 flow. Sludge waste
- Page 260 and 261:
Table 5.15 Water quality data, Unif
- Page 262 and 263:
TMP (Kpa) 80 70 60 50 40 30 20 10 0
- Page 264 and 265:
10 LMH; the plant operated at fluxe
- Page 266 and 267:
Table 5.17 Feed and treated water q
- Page 268 and 269:
Table 5.18 Water quality, Sobelgra
- Page 270 and 271:
Figure 5.37 Airlift municipal WWTP,
- Page 272 and 273:
Case studies 255 has been 20 g/L, b
- Page 274 and 275:
Case studies 257 The company had in
- Page 276 and 277:
Filtrate (ml) 25 20 15 10 5 IIndust
- Page 278 and 279:
Inflow Buffer tank Filtration Denit
- Page 280 and 281:
Figure 5.45 The VHP MBR (a) (b) Cas
- Page 282 and 283:
Figure 5.47 The Eden Project MBR Ba
- Page 284 and 285:
Table 5.25 Basis for process design
- Page 286 and 287:
5.4.7 Other Orelis plant Case studi
- Page 288 and 289:
two membrane module configurations.
- Page 290 and 291:
Appendix A Blower Power Consumption
- Page 292 and 293:
or or (A.4) where � is the ratio
- Page 294 and 295:
Appendix B MBR Biotreatment Base Pa
- Page 296 and 297:
Y 0.61 g VSS/g COD Fan et al. (1996
- Page 298 and 299:
Appendix C Hollow Fibre Module Para
- Page 300 and 301:
L being the internal module length
- Page 302 and 303:
Appendix D Membrane Products
- Page 304 and 305:
Table D.3 Membrane module details o
- Page 306 and 307:
Table D.4 (continued) Supplier Asah
- Page 308 and 309:
Table D.5 Membrane module details o
- Page 310 and 311:
Appendix E Major Recent MBR and Was
- Page 312 and 313:
Conference title meet Dates Locatio
- Page 314 and 315:
Event Last held Location Website Fo
- Page 316 and 317:
Appendix F Selected Professional an
- Page 318 and 319:
Japan Water Works Association (JWWA
- Page 320 and 321:
Nomenclature � Separation (m) �
- Page 322 and 323:
Nomenclature 305 Rsup Hydraulic res
- Page 324 and 325:
Abbreviations The following lists k
- Page 326 and 327:
PES Polyethylsulphone PP Polypropyl
- Page 328 and 329:
Glossary of Terms A number of key t
- Page 330 and 331:
Floc Aggregated solid (biomass) par
- Page 332 and 333:
Glossary of terms 315 Relaxation Ce
- Page 334 and 335:
Index A � factor 47, 49-50 and vi
- Page 336 and 337:
investment 9 for membrane replaceme
- Page 338 and 339:
I Iberia 2 immersed biomass-rejecti
- Page 340 and 341:
Nordkanal wastewater treatment work
- Page 342:
SUR unit 180 surface porosity 30 Su