Monograph on the Potential Human Reproductive and ... - OEHHA
Monograph on the Potential Human Reproductive and ... - OEHHA
Monograph on the Potential Human Reproductive and ... - OEHHA

Create successful ePaper yourself
Turn your PDF publications into a flip-book with our unique Google optimized e-Paper software.
BISPHENOL A<br />
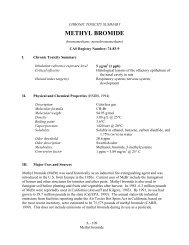
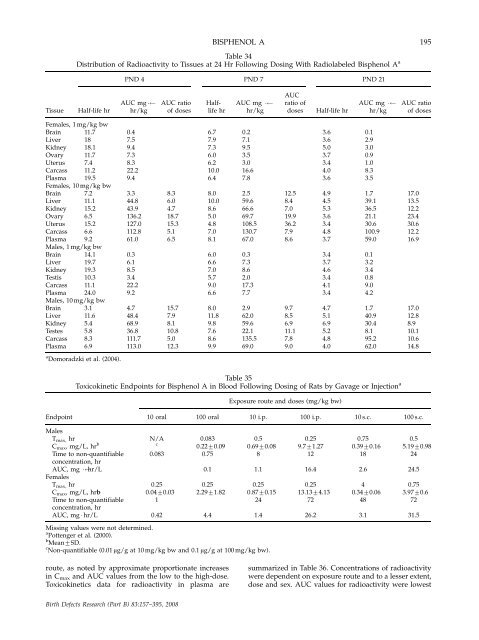
Table 34<br />
Distributi<strong>on</strong> of Radioactivity to Tissues at 24 Hr Following Dosing With Radiolabeled Bisphenol A a<br />
PND 4 PND 7 PND 21<br />
AUC<br />
AUC mg � AUC ratio Half- AUC mg � ratio of AUC mg � AUC ratio<br />
Tissue Half-life hr hr/kg of doses life hr hr/kg doses Half-life hr hr/kg of doses<br />
Females, 1 mg/kg bw<br />
Brain 11.7 0.4 6.7 0.2 3.6 0.1<br />
Liver 18 7.5 7.9 7.1 3.6 2.9<br />
Kidney 18.1 9.4 7.3 9.5 5.0 3.0<br />
Ovary 11.7 7.3 6.0 3.5 3.7 0.9<br />
Uterus 7.4 8.3 6.2 3.0 3.4 1.0<br />
Carcass 11.2 22.2 10.0 16.6 4.0 8.3<br />
Plasma 19.5 9.4 6.4 7.8 3.6 3.5<br />
Females, 10 mg/kg bw<br />
Brain 7.2 3.3 8.3 8.0 2.5 12.5 4.9 1.7 17.0<br />
Liver 11.1 44.8 6.0 10.0 59.6 8.4 4.5 39.1 13.5<br />
Kidney 15.2 43.9 4.7 8.6 66.6 7.0 5.3 36.5 12.2<br />
Ovary 6.5 136.2 18.7 5.0 69.7 19.9 3.6 21.1 23.4<br />
Uterus 15.2 127.0 15.3 4.8 108.5 36.2 3.4 30.6 30.6<br />
Carcass 6.6 112.8 5.1 7.0 130.7 7.9 4.8 100.9 12.2<br />
Plasma 9.2 61.0 6.5 8.1 67.0 8.6 3.7 59.0 16.9<br />
Males, 1 mg/kg bw<br />
Brain 14.1 0.3 6.0 0.3 3.4 0.1<br />
Liver 19.7 6.1 6.6 7.3 3.7 3.2<br />
Kidney 19.3 8.5 7.0 8.6 4.6 3.4<br />
Testis 10.3 3.4 5.7 2.0 3.4 0.8<br />
Carcass 11.1 22.2 9.0 17.3 4.1 9.0<br />
Plasma 24.0 9.2 6.6 7.7 3.4 4.2<br />
Males, 10 mg/kg bw<br />
Brain 3.1 4.7 15.7 8.0 2.9 9.7 4.7 1.7 17.0<br />
Liver 11.6 48.4 7.9 11.8 62.0 8.5 5.1 40.9 12.8<br />
Kidney 5.4 68.9 8.1 9.8 59.6 6.9 6.9 30.4 8.9<br />
Testes 5.8 36.8 10.8 7.6 22.1 11.1 5.2 8.1 10.1<br />
Carcass 8.3 111.7 5.0 8.6 135.5 7.8 4.8 95.2 10.6<br />
Plasma 6.9 113.0 12.3 9.9 69.0 9.0 4.0 62.0 14.8<br />
a Domoradzki et al. (2004).<br />
Table 35<br />
Toxicokinetic Endpoints for Bisphenol A in Blood Following Dosing of Rats by Gavage or Injecti<strong>on</strong> a<br />
Exposure route <strong>and</strong> doses (mg/kg bw)<br />
Endpoint 10 oral 100 oral 10 i.p. 100 i.p. 10 s.c. 100 s.c.<br />
Males<br />
Tmax, hr N/A 0.083 0.5 0.25 0.75 0.5<br />
Cmax, mg/L, hr<br />
c<br />
b<br />
0.2270.09 0.6970.08 9.771.27 0.3970.16 5.1970.98<br />
Time to n<strong>on</strong>-quantifiable<br />
c<strong>on</strong>centrati<strong>on</strong>, hr<br />
0.083 0.75 8 12 18 24<br />
AUC, mg � hr/L<br />
Females<br />
0.1 1.1 16.4 2.6 24.5<br />
Tmax, hr 0.25 0.25 0.25 0.25 4 0.75<br />
Cmax, mg/L, hrb 0.0470.03 2.2971.82 0.8770.15 13.1374.13 0.3470.06 3.9770.6<br />
Time to n<strong>on</strong>-quantifiable<br />
c<strong>on</strong>centrati<strong>on</strong>, hr<br />
1 24 72 48 72<br />
AUC, mg � hr/L 0.42 4.4 1.4 26.2 3.1 31.5<br />
Missing values were not determined.<br />
a<br />
Pottenger et al. (2000).<br />
b<br />
Mean7SD.<br />
c<br />
N<strong>on</strong>-quantifiable (0.01 mg/g at 10 mg/kg bw <strong>and</strong> 0.1 mg/g at 100 mg/kg bw).<br />
route, as noted by approximate proporti<strong>on</strong>ate increases summarized in Table 36. C<strong>on</strong>centrati<strong>on</strong>s of radioactivity<br />
in Cmax <strong>and</strong> AUC values from <strong>the</strong> low to <strong>the</strong> high-dose. were dependent <strong>on</strong> exposure route <strong>and</strong> to a lesser extent,<br />
Toxicokinetics data for radioactivity in plasma are dose <strong>and</strong> sex. AUC values for radioactivity were lowest<br />
Birth Defects Research (Part B) 83:157–395, 2008<br />
195