Monograph on the Potential Human Reproductive and ... - OEHHA
Monograph on the Potential Human Reproductive and ... - OEHHA
Monograph on the Potential Human Reproductive and ... - OEHHA

Create successful ePaper yourself
Turn your PDF publications into a flip-book with our unique Google optimized e-Paper software.
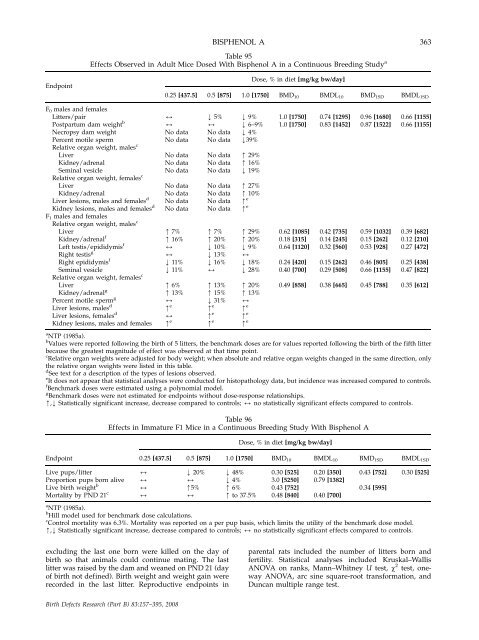
Endpoint<br />
BISPHENOL A 363<br />
Table 95<br />
Effects Observed in Adult Mice Dosed With Bisphenol A in a C<strong>on</strong>tinuous Breeding Study a<br />
Dose, % in diet [mg/kg bw/day]<br />
0.25 [437.5] 0.5 [875] 1.0 [1750] BMD10 BMDL10 BMD1SD BMDL1SD<br />
F0 males <strong>and</strong> females<br />
Litters/pair 2 k 5% k 9% 1.0 [1750] 0.74 [1295] 0.96 [1680] 0.66 [1155]<br />
Postpartum dam weight b<br />
2 2 k 6–9% 1.0 [1750] 0.83 [1452] 0.87 [1522] 0.66 [1155]<br />
Necropsy dam weight No data No data k 4%<br />
Percent motile sperm<br />
Relative organ weight, males<br />
No data No data k39%<br />
c<br />
Liver No data No data m 29%<br />
Kidney/adrenal No data No data m 16%<br />
Seminal vesicle<br />
Relative organ weight, females<br />
No data No data k 19%<br />
c<br />
Liver No data No data m 27%<br />
Kidney/adrenal No data No data m 10%<br />
Liver lesi<strong>on</strong>s, males <strong>and</strong> females d<br />
No data No data m e<br />
Kidney lesi<strong>on</strong>s, males <strong>and</strong> females d No data No data m e<br />
F1 males <strong>and</strong> females<br />
Relative organ weight, males c<br />
Liver m 7% m 7% m 29% 0.62 [1085] 0.42 [735] 0.59 [1032] 0.39 [682]<br />
Kidney/adrenal f<br />
m 16% m 20% m 20% 0.18 [315] 0.14 [245] 0.15 [262] 0.12 [210]<br />
Left testis/epididymis f<br />
2 k 10% k 9% 0.64 [1120] 0.32 [560] 0.53 [928] 0.27 [472]<br />
Right testis g<br />
2 k 13% 2<br />
Right epididymis f<br />
k 11% k 16% k 18% 0.24 [420] 0.15 [262] 0.46 [805] 0.25 [438]<br />
Seminal vesicle<br />
Relative organ weight, females<br />
k 11% 2 k 28% 0.40 [700] 0.29 [508] 0.66 [1155] 0.47 [822]<br />
c<br />
Liver m 6% m 13% m 20% 0.49 [858] 0.38 [665] 0.45 [788] 0.35 [612]<br />
Kidney/adrenal g<br />
m 13% m 15% m 13%<br />
Percent motile sperm g<br />
2 k 31% 2<br />
Liver lesi<strong>on</strong>s, males d<br />
m e<br />
m e<br />
m e<br />
Liver lesi<strong>on</strong>s, females d<br />
2 m e<br />
m e<br />
Kidney lesi<strong>on</strong>s, males <strong>and</strong> females m e<br />
m e<br />
m e<br />
a<br />
NTP (1985a).<br />
b<br />
Values were reported following <strong>the</strong> birth of 5 litters, <strong>the</strong> benchmark doses are for values reported following <strong>the</strong> birth of <strong>the</strong> fifth litter<br />
because <strong>the</strong> greatest magnitude of effect was observed at that time point.<br />
c<br />
Relative organ weights were adjusted for body weight; when absolute <strong>and</strong> relative organ weights changed in <strong>the</strong> same directi<strong>on</strong>, <strong>on</strong>ly<br />
<strong>the</strong> relative organ weights were listed in this table.<br />
d<br />
See text for a descripti<strong>on</strong> of <strong>the</strong> types of lesi<strong>on</strong>s observed.<br />
e<br />
It does not appear that statistical analyses were c<strong>on</strong>ducted for histopathology data, but incidence was increased compared to c<strong>on</strong>trols.<br />
f<br />
Benchmark doses were estimated using a polynomial model.<br />
g<br />
Benchmark doses were not estimated for endpoints without dose-resp<strong>on</strong>se relati<strong>on</strong>ships.<br />
m,k Statistically significant increase, decrease compared to c<strong>on</strong>trols; 2 no statistically significant effects compared to c<strong>on</strong>trols.<br />
Table 96<br />
Effects in Immature F1 Mice in a C<strong>on</strong>tinuous Breeding Study With Bisphenol A<br />
Dose, % in diet [mg/kg bw/day]<br />
Endpoint 0.25 [437.5] 0.5 [875] 1.0 [1750] BMD 10 BMDL 10 BMD 1SD BMDL 1SD<br />
Live pups/litter<br />
Proporti<strong>on</strong> pups born alive<br />
Live birth weight b<br />
Mortality by PND 21 c<br />
2<br />
2<br />
2<br />
2<br />
k 20%<br />
2<br />
m5%<br />
2<br />
k 48%<br />
k 4%<br />
m 6%<br />
m to 37.5%<br />
0.30 [525]<br />
3.0 [5250]<br />
0.43 [752]<br />
0.48 [840]<br />
0.20 [350]<br />
0.79 [1382]<br />
0.40 [700]<br />
0.43 [752]<br />
0.34 [595]<br />
a NTP (1985a).<br />
b Hill model used for benchmark dose calculati<strong>on</strong>s.<br />
c C<strong>on</strong>trol mortality was 6.3%. Mortality was reported <strong>on</strong> a per pup basis, which limits <strong>the</strong> utility of <strong>the</strong> benchmark dose model.<br />
m,k Statistically significant increase, decrease compared to c<strong>on</strong>trols; 2 no statistically significant effects compared to c<strong>on</strong>trols.<br />
0.30 [525]<br />
excluding <strong>the</strong> last <strong>on</strong>e born were killed <strong>on</strong> <strong>the</strong> day of parental rats included <strong>the</strong> number of litters born <strong>and</strong><br />
birth so that animals could c<strong>on</strong>tinue mating. The last fertility. Statistical analyses included Kruskal–Wallis<br />
litter was raised by <strong>the</strong> dam <strong>and</strong> weaned <strong>on</strong> PND 21 (day ANOVA <strong>on</strong> ranks, Mann–Whitney U test, w 2 test, <strong>on</strong>eof<br />
birth not defined). Birth weight <strong>and</strong> weight gain were way ANOVA, arc sine square-root transformati<strong>on</strong>, <strong>and</strong><br />
recorded in <strong>the</strong> last litter. <strong>Reproductive</strong> endpoints in Duncan multiple range test.<br />
Birth Defects Research (Part B) 83:157–395, 2008