

table of contents - Research and Innovative Technology ...
table of contents - Research and Innovative Technology ...
table of contents - Research and Innovative Technology ...

You also want an ePaper? Increase the reach of your titles
YUMPU automatically turns print PDFs into web optimized ePapers that Google loves.
well as the condition <strong>and</strong> performance <strong>of</strong> the<br />
U.S. transportation system, which currently<br />
<strong>of</strong>fers U.S. residents the world’s highest level <strong>of</strong><br />
personal mobility. It proceeds to a discussion <strong>of</strong><br />
transportation’s importance to the economy <strong>and</strong><br />
society as indicated by a variety <strong>of</strong> economic<br />
indicators. Next, Part I describes the unintended<br />
consequences—accidents, fatalities, <strong>and</strong> oil<br />
import dependency—associated with transportation.<br />
Finally, it explores the state <strong>of</strong> transportation<br />
statistics.<br />
This year’s theme section, “Transportation<br />
<strong>and</strong> the Environment” (Part II <strong>of</strong> the report), surveys<br />
the collateral damage to the environment<br />
arising from transportation. It focuses on the<br />
scale <strong>and</strong> dimensions <strong>of</strong> the damage, <strong>and</strong> the<br />
effect <strong>of</strong> actions to ameliorate the damage. Part<br />
II surveys transportation-related environmental<br />
trends for three geographical scales—nationallevel<br />
trends <strong>and</strong> impacts, air quality at the metropolitan<br />
level, <strong>and</strong> a comparison <strong>of</strong> U.S.<br />
transport-related air pollution with that in several<br />
industrialized <strong>and</strong> developing countries. As<br />
noted in Part II, vehicle emissions have decreased<br />
impressively in the United States, but<br />
some pollutants have increased recently, suggesting<br />
the need for continued monitoring <strong>of</strong><br />
pollution trends.<br />
�The State <strong>of</strong> the<br />
Transportation System<br />
Travel, the Movement <strong>of</strong> Freight,<br />
<strong>and</strong> the Transportation System<br />
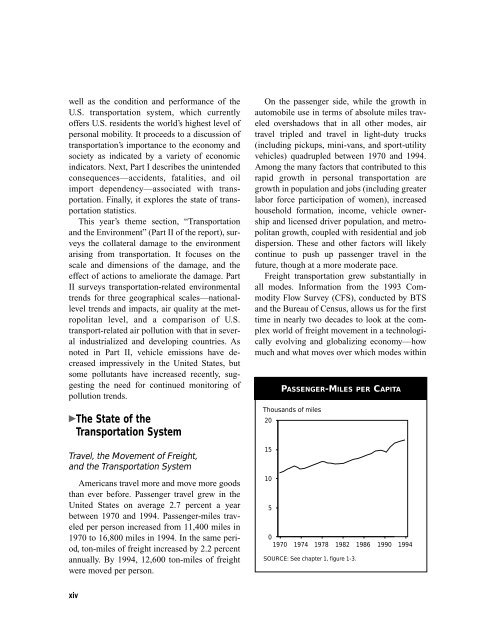
Americans travel more <strong>and</strong> move more goods<br />
than ever before. Passenger travel grew in the<br />
United States on average 2.7 percent a year<br />
between 1970 <strong>and</strong> 1994. Passenger-miles traveled<br />
per person increased from 11,400 miles in<br />
1970 to 16,800 miles in 1994. In the same period,<br />
ton-miles <strong>of</strong> freight increased by 2.2 percent<br />
annually. By 1994, 12,600 ton-miles <strong>of</strong> freight<br />
were moved per person.<br />
xiv<br />
On the passenger side, while the growth in<br />
automobile use in terms <strong>of</strong> absolute miles traveled<br />
overshadows that in all other modes, air<br />
travel tripled <strong>and</strong> travel in light-duty trucks<br />
(including pickups, mini-vans, <strong>and</strong> sport-utility<br />
vehicles) quadrupled between 1970 <strong>and</strong> 1994.<br />
Among the many factors that contributed to this<br />
rapid growth in personal transportation are<br />
growth in population <strong>and</strong> jobs (including greater<br />
labor force participation <strong>of</strong> women), increased<br />
household formation, income, vehicle ownership<br />
<strong>and</strong> licensed driver population, <strong>and</strong> metropolitan<br />
growth, coupled with residential <strong>and</strong> job<br />
dispersion. These <strong>and</strong> other factors will likely<br />
continue to push up passenger travel in the<br />
future, though at a more moderate pace.<br />
Freight transportation grew substantially in<br />
all modes. Information from the 1993 Commodity<br />
Flow Survey (CFS), conducted by BTS<br />
<strong>and</strong> the Bureau <strong>of</strong> Census, allows us for the first<br />
time in nearly two decades to look at the complex<br />
world <strong>of</strong> freight movement in a technologically<br />
evolving <strong>and</strong> globalizing economy—how<br />
much <strong>and</strong> what moves over which modes within<br />
Thous<strong>and</strong>s <strong>of</strong> miles<br />
20<br />
15<br />
10<br />
5<br />
0<br />
1970<br />
PASSENGER-MILES PER CAPITA<br />
1974 1978 1982 1986 1990 1994<br />
SOURCE: See chapter 1, figure 1-3.


