

table of contents - Research and Innovative Technology ...
table of contents - Research and Innovative Technology ...
table of contents - Research and Innovative Technology ...

Create successful ePaper yourself
Turn your PDF publications into a flip-book with our unique Google optimized e-Paper software.
236 � Transportation Statistics Annual Report 1996<br />
Number <strong>of</strong> air carriers<br />
�� �� �� �� �<br />
��� �� �� �� ���<br />
�� ����<br />
�� �� �� ���<br />
�� �<br />
�� ��� �� �� �� ����<br />
�� ��� �� �� �� ���<br />
�� ����<br />
�� �� �� ���<br />
�� �<br />
�� ��� �� �� �� ����<br />
�� ��� �� �� �� ���<br />
�� ����<br />
�� �� �� ���<br />
�� �<br />
�� ��� �� �� �� ����<br />
�� ��� �� �� �� ���<br />
�� ����<br />
�� �� �� ���<br />
�� �<br />
�� ��� �� �� �� ����<br />
�� ��� �� �� �� ���<br />
�� ����<br />
�� �� �� ���<br />
�� �<br />
100<br />
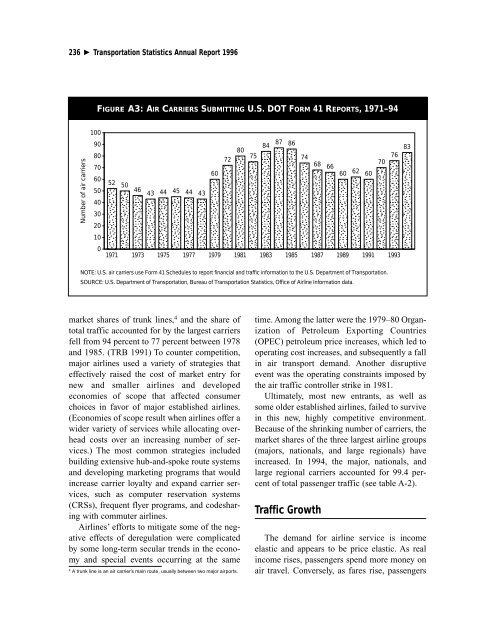
FIGURE A3: AIR CARRIERS SUBMITTING U.S. DOT FORM 41 REPORTS, 1971–94<br />
90<br />
80<br />
70<br />
60<br />
50<br />
40<br />
30<br />
20<br />
10<br />
0<br />
52 50 46 43 44 45 44 43<br />
market shares <strong>of</strong> trunk lines, 4 <strong>and</strong> the share <strong>of</strong><br />
total traffic accounted for by the largest carriers<br />
fell from 94 percent to 77 percent between 1978<br />
<strong>and</strong> 1985. (TRB 1991) To counter competition,<br />
major airlines used a variety <strong>of</strong> strategies that<br />
effectively raised the cost <strong>of</strong> market entry for<br />
new <strong>and</strong> smaller airlines <strong>and</strong> developed<br />
economies <strong>of</strong> scope that affected consumer<br />
choices in favor <strong>of</strong> major established airlines.<br />
(Economies <strong>of</strong> scope result when airlines <strong>of</strong>fer a<br />
wider variety <strong>of</strong> services while allocating overhead<br />
costs over an increasing number <strong>of</strong> services.)<br />
The most common strategies included<br />
building extensive hub-<strong>and</strong>-spoke route systems<br />
<strong>and</strong> developing marketing programs that would<br />
increase carrier loyalty <strong>and</strong> exp<strong>and</strong> carrier services,<br />
such as computer reservation systems<br />
(CRSs), frequent flyer programs, <strong>and</strong> codesharing<br />
with commuter airlines.<br />
Airlines’ efforts to mitigate some <strong>of</strong> the negative<br />
effects <strong>of</strong> deregulation were complicated<br />
by some long-term secular trends in the economy<br />
<strong>and</strong> special events occurring at the same<br />
60<br />
72<br />
80 75<br />
84 87 86<br />
74<br />
time. Among the latter were the 1979–80 Organization<br />
<strong>of</strong> Petroleum Exporting Countries<br />
(OPEC) petroleum price increases, which led to<br />
operating cost increases, <strong>and</strong> subsequently a fall<br />
in air transport dem<strong>and</strong>. Another disruptive<br />
event was the operating constraints imposed by<br />
the air traffic controller strike in 1981.<br />
Ultimately, most new entrants, as well as<br />
some older established airlines, failed to survive<br />
in this new, highly competitive environment.<br />
Because <strong>of</strong> the shrinking number <strong>of</strong> carriers, the<br />
market shares <strong>of</strong> the three largest airline groups<br />
(majors, nationals, <strong>and</strong> large regionals) have<br />
increased. In 1994, the major, nationals, <strong>and</strong><br />
large regional carriers accounted for 99.4 percent<br />
<strong>of</strong> total passenger traffic (see <strong>table</strong> A-2).<br />
Traffic Growth<br />
68 66<br />
60 62 60<br />
1971 1973 1975 1977 1979 1981 1983 1985 1987 1989 1991 1993<br />
NOTE: U.S. air carriers use Form 41 Schedules to report financial <strong>and</strong> traffic information to the U.S. Department <strong>of</strong> Transportation.<br />
SOURCE: U.S. Department <strong>of</strong> Transportation, Bureau <strong>of</strong> Transportation Statistics, Office <strong>of</strong> Airline Information data.<br />
4 A trunk line is an air carrier’s main route, usually between two major airports.<br />
The dem<strong>and</strong> for airline service is income<br />
elastic <strong>and</strong> appears to be price elastic. As real<br />
income rises, passengers spend more money on<br />
air travel. Conversely, as fares rise, passengers<br />
70<br />
76<br />
83


