

table of contents - Research and Innovative Technology ...
table of contents - Research and Innovative Technology ...
table of contents - Research and Innovative Technology ...

You also want an ePaper? Increase the reach of your titles
YUMPU automatically turns print PDFs into web optimized ePapers that Google loves.
Canadian Airlines International, 1995; United-Air<br />
Canada, 1995). These arrangements have developed<br />
into a succession <strong>of</strong> relationships, from<br />
intercarrier agreements to joint operations to partial<br />
ownership in some cases. Codesharing allows<br />
airlines to sell tickets <strong>and</strong> provide service to<br />
points beyond their immediate route network.<br />
Industry Financial Performance<br />
The strength <strong>of</strong> the industry’s financial condition<br />
determines its ability to withst<strong>and</strong> periods<br />
<strong>of</strong> recession <strong>and</strong> attract enough capital to replace<br />
<strong>and</strong> exp<strong>and</strong> its fleets. Its financial condition also<br />
affects its ability to comply with environmental<br />
<strong>and</strong> energy st<strong>and</strong>ards. To date, the airline industry’s<br />
financial performance has been mixed.<br />
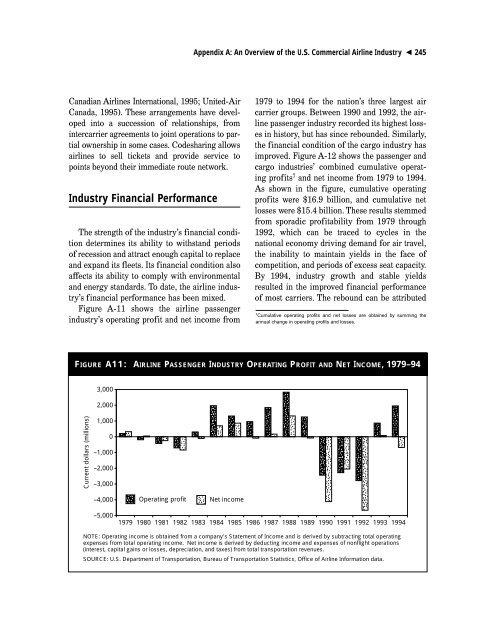
Figure A-11 shows the airline passenger<br />
industry’s operating pr<strong>of</strong>it <strong>and</strong> net income from<br />
Current dollars (millions)<br />
3,000<br />
2,000<br />
�����<br />
��<br />
������������<br />
��<br />
1,000<br />
0<br />
–1,000<br />
Appendix A: An Overview <strong>of</strong> the U.S. Commercial Airline Industry � 245<br />
1979 to 1994 for the nation’s three largest air<br />
carrier groups. Between 1990 <strong>and</strong> 1992, the airline<br />
passenger industry recorded its highest losses<br />
in history, but has since rebounded. Similarly,<br />
the financial condition <strong>of</strong> the cargo industry has<br />
improved. Figure A-12 shows the passenger <strong>and</strong><br />
cargo industries’ combined cumulative operating<br />
pr<strong>of</strong>its 7 <strong>and</strong> net income from 1979 to 1994.<br />
As shown in the figure, cumulative operating<br />
pr<strong>of</strong>its were $16.9 billion, <strong>and</strong> cumulative net<br />
losses were $15.4 billion. These results stemmed<br />
from sporadic pr<strong>of</strong>itability from 1979 through<br />
1992, which can be traced to cycles in the<br />
national economy driving dem<strong>and</strong> for air travel,<br />
the inability to maintain yields in the face <strong>of</strong><br />
competition, <strong>and</strong> periods <strong>of</strong> excess seat capacity.<br />
By 1994, industry growth <strong>and</strong> s<strong>table</strong> yields<br />
resulted in the improved financial performance<br />
<strong>of</strong> most carriers. The rebound can be attributed<br />
7 Cumulative operating pr<strong>of</strong>its <strong>and</strong> net losses are obtained by summing the<br />
annual change in operating pr<strong>of</strong>its <strong>and</strong> losses.<br />
FIGURE A11: AIRLINE PASSENGER INDUSTRY OPERATING PROFIT AND NET INCOME, 1979–94<br />
���<br />
��� �� �� �� �<br />
��� �� �� �� ��� �<br />
�� �<br />
�� � �� �<br />
��� �� ��� �<br />
���<br />
�� ��� ���<br />
��<br />
��� �� ��� ��<br />
��� ���<br />
�� ���<br />
�����<br />
�� ����<br />
–2,000<br />
��<br />
–3,000<br />
–4,000<br />
��<br />
��Operating pr<strong>of</strong>it Net income<br />
–5,000<br />
1979 1980 1981 1982 1983 1984 1985 1986 1987 1988 1989 1990 1991 1992 1993 1994<br />
NOTE: Operating income is obtained from a company's Statement <strong>of</strong> Income <strong>and</strong> is derived by subtracting total operating<br />
expenses from total operating income. Net income is derived by deducting income <strong>and</strong> expenses <strong>of</strong> nonflight operations<br />
(interest, capital gains or losses, depreciation, <strong>and</strong> taxes) from total transportation revenues.<br />
SOURCE: U.S. Department <strong>of</strong> Transportation, Bureau <strong>of</strong> Transportation Statistics, Office <strong>of</strong> Airline Information data.


