Le fumage du poisson - Archimer, archive institutionnelle de l'Ifremer
Le fumage du poisson - Archimer, archive institutionnelle de l'Ifremer
Le fumage du poisson - Archimer, archive institutionnelle de l'Ifremer

Create successful ePaper yourself
Turn your PDF publications into a flip-book with our unique Google optimized e-Paper software.
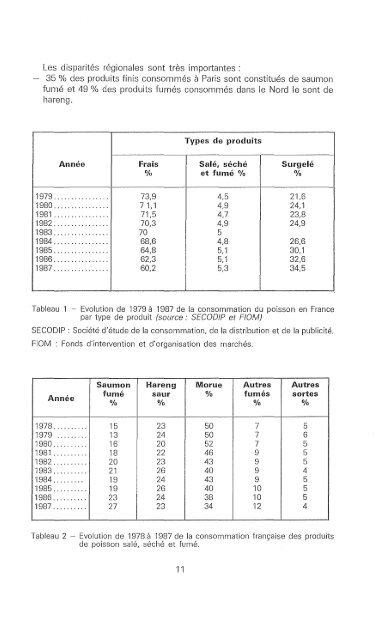
<strong>Le</strong>s disparités régionales sont très importantes:<br />
- 35 % <strong>de</strong>s pro<strong>du</strong>its finis consommés à Paris sont constitués <strong>de</strong> saumon<br />
fumé et 49 % <strong>de</strong>s pro<strong>du</strong>its fumés consommés dans le Nord le sont <strong>de</strong><br />
hareng.<br />
Types <strong>de</strong> pro<strong>du</strong>its<br />
Année Frais Salé, séché Surgelé<br />
% et fumé 0/0 %<br />
1979 ................ 73,9 4,5 21,6<br />
1980 ................ 71,1 4,9 24,1<br />
1981 ................ 71,5 4,7 23,8<br />
1982 ................ 70,3 4,9 24,9<br />
1983 ................ 70 5<br />
1984 ................ 68,6 4,8 26,6<br />
1985 ................ 64,8 5,1 30,1<br />
1986 ................ 62,3 5,1 32,6<br />
1987 ................ 60,2 5,3 34,5<br />
Tableau 1 - Evolution <strong>de</strong> 1979 à 1987 <strong>de</strong> la consommation <strong>du</strong> <strong>poisson</strong> en France<br />
par type <strong>de</strong> pro<strong>du</strong>it (source: SECOOIP et FIOM)<br />
SECODIP : Société d'étu<strong>de</strong> <strong>de</strong> la consommation, <strong>de</strong> la distribution et <strong>de</strong> la publicité.<br />
FIOM : Fonds d'intervention et d'organisation <strong>de</strong>s marchés.<br />
Année<br />
Saumon Hareng Morue Autres Autres<br />
fumé saur % fumés sortes<br />
% % % %<br />
1978 .......... 15 23 50 7 5<br />
1979 ......... 13 24 50 7 6<br />
1980 .......... 16 20 52 7 5<br />
1981 .......... 18 22 46 9 5<br />
1982 .......... 20 23 43 9 5<br />
1983 .......... 21 26 40 9 4<br />
1984 ......... 19 24 43 9 5<br />
1985 .......... 19 26 40 10 5<br />
1986 .......... 23 24 38 10 5<br />
1987 .......... 27 23 34 12 4<br />
Tableau 2 - Evolution <strong>de</strong> 1978 à 1987 <strong>de</strong> la consommation française <strong>de</strong>s pro<strong>du</strong>its<br />
<strong>de</strong> <strong>poisson</strong> salé, séché et fumé.<br />
11