
Create successful ePaper yourself
Turn your PDF publications into a flip-book with our unique Google optimized e-Paper software.
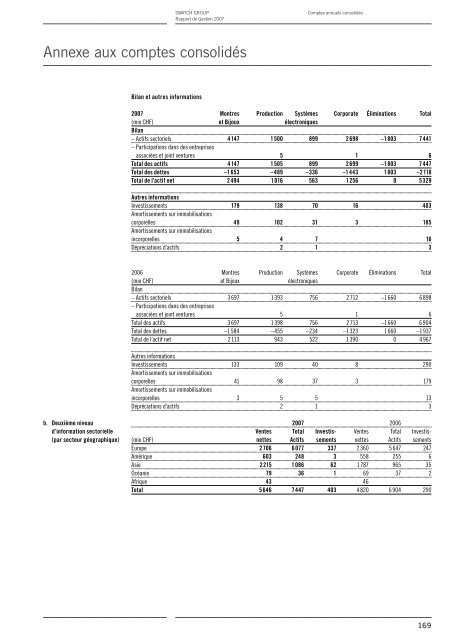
Annexe aux comptes consolidés<br />
b. Deuxième niveau<br />
d’information sectorielle<br />
(par secteur géographique)<br />
SWATCH GROUP<br />
<strong>Rapport</strong> <strong>de</strong> <strong>Gestion</strong> <strong>2007</strong><br />
Bilan et autres informations<br />
Comptes annuels consolidés<br />
<strong>2007</strong> Montres Production Systèmes Corporate Éliminations Total<br />
(mio CHF) et Bijoux électroniques<br />
Bilan<br />
– Actifs sectoriels 4 147 1 500 899 2 698 –1 803 7 441<br />
– Participations dans <strong>de</strong>s entreprises<br />
associées et joint ventures 5 1 6<br />
Total <strong>de</strong>s actifs 4 147 1 505 899 2 699 –1 803 7 447<br />
Total <strong>de</strong>s <strong>de</strong>ttes –1 653 –489 –336 –1 443 1 803 –2 118<br />
Total <strong>de</strong> l’actif net 2 494 1 016 563 1 256 0 5 329<br />
Autres informations<br />
Investissements 179 138 70 16 403<br />
Amortissements sur immobilisations<br />
corporelles 49 102 31 3 185<br />
Amortissements sur immobilisations<br />
incorporelles 5 4 7 16<br />
Dépréciations d’actifs 2 1 3<br />
2006 Montres Production Systèmes Corporate Éliminations Total<br />
(mio CHF) et Bijoux électroniques<br />
Bilan<br />
– Actifs sectoriels 3 697 1 393 756 2 712 –1 660 6 898<br />
– Participations dans <strong>de</strong>s entreprises<br />
associées et joint ventures 5 1 6<br />
Total <strong>de</strong>s actifs 3 697 1 398 756 2 713 –1 660 6 904<br />
Total <strong>de</strong>s <strong>de</strong>ttes –1 584 –455 –234 –1 323 1 660 –1 937<br />
Total <strong>de</strong> l’actif net 2 113 943 522 1 390 0 4 967<br />
Autres informations<br />
Investissements 133 109 40 8 290<br />
Amortissements sur immobilisations<br />
corporelles 41 98 37 3 179<br />
Amortissements sur immobilisations<br />
incorporelles 3 5 5 13<br />
Dépréciations d’actifs 2 1 3<br />
<strong>2007</strong> 2006<br />
Ventes Total Investis- Ventes Total Investis-<br />
(mio CHF) nettes Actifs sements nettes Actifs sements<br />
Europe 2 706 6 077 337 2 360 5 647 247<br />
Amérique 603 248 3 558 255 6<br />
Asie 2 215 1 086 62 1 787 965 35<br />
Océanie 79 36 1 69 37 2<br />
Afrique 43 46<br />
Total 5 646 7 447 403 4 820 6 904 290<br />
169