L'esclusione sociale in Lombardia - Eupolis Lombardia - Regione ...
L'esclusione sociale in Lombardia - Eupolis Lombardia - Regione ...
L'esclusione sociale in Lombardia - Eupolis Lombardia - Regione ...

You also want an ePaper? Increase the reach of your titles
YUMPU automatically turns print PDFs into web optimized ePapers that Google loves.
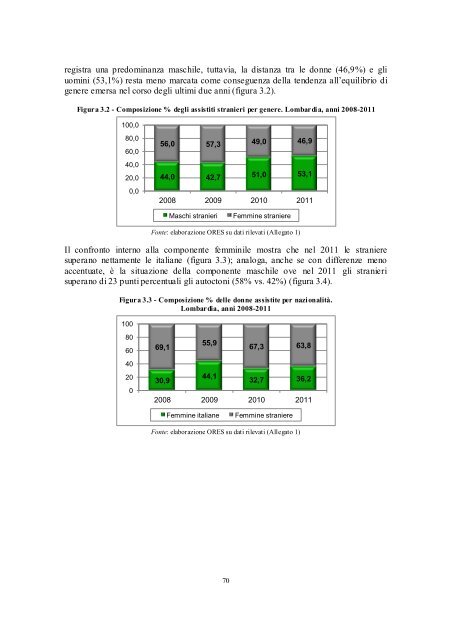
egistra una predom<strong>in</strong>anza maschile, tuttavia, la distanza tra le donne (46,9%) e gli<br />
uom<strong>in</strong>i (53,1%) resta meno marcata come conseguenza della tendenza all’equilibrio di<br />
genere emersa nel corso degli ultimi due anni (figura 3.2).<br />
Figura 3.2 - Composizione % degli assistiti stranieri per genere. <strong>Lombardia</strong>, anni 2008-2011<br />
100,0<br />
80,0<br />
60,0<br />
40,0<br />
20,0<br />
0,0<br />
56,0 57,3 49,0 46,9<br />
44,0 42,7 51,0 53,1<br />
2008 2009 2010 2011<br />
Maschi stranieri Femm<strong>in</strong>e straniere<br />
Fonte: elaborazione ORES su dati rilevati (Allegato 1)<br />
Il confronto <strong>in</strong>terno alla componente femm<strong>in</strong>ile mostra che nel 2011 le straniere<br />
superano nettamente le italiane (figura 3.3); analoga, anche se con differenze meno<br />
accentuate, è la situazione della componente maschile ove nel 2011 gli stranieri<br />
superano di 23 punti percentuali gli autoctoni (58% vs. 42%) (figura 3.4).<br />
Figura 3.3 - Composizione % delle donne assistite per nazionalità.<br />
<strong>Lombardia</strong>, anni 2008-2011<br />
100<br />
80<br />
60<br />
40<br />
20<br />
0<br />
69,1<br />
30,9<br />
55,9<br />
44,1<br />
70<br />
67,3<br />
32,7<br />
63,8<br />
36,2<br />
2008 2009 2010 2011<br />
Femm<strong>in</strong>e italiane Femm<strong>in</strong>e straniere<br />
Fonte: elaborazione ORES su dati rilevati (Allegato 1)