Copyright by William Lloyd Bircher 2010 - The Laboratory for ...
Copyright by William Lloyd Bircher 2010 - The Laboratory for ...
Copyright by William Lloyd Bircher 2010 - The Laboratory for ...
You also want an ePaper? Increase the reach of your titles
YUMPU automatically turns print PDFs into web optimized ePapers that Google loves.
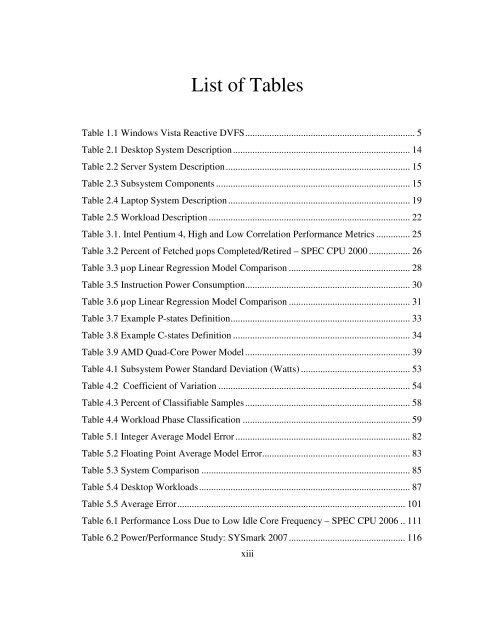
List of Tables<br />
Table 1.1 Windows Vista Reactive DVFS ...................................................................... 5<br />
Table 2.1 Desktop System Description ......................................................................... 14<br />
Table 2.2 Server System Description ............................................................................ 15<br />
Table 2.3 Subsystem Components ................................................................................ 15<br />
Table 2.4 Laptop System Description ........................................................................... 19<br />
Table 2.5 Workload Description ................................................................................... 22<br />
Table 3.1. Intel Pentium 4, High and Low Correlation Per<strong>for</strong>mance Metrics .............. 25<br />
Table 3.2 Percent of Fetched µops Completed/Retired – SPEC CPU 2000 ................. 26<br />
Table 3.3 µop Linear Regression Model Comparison .................................................. 28<br />
Table 3.5 Instruction Power Consumption .................................................................... 30<br />
Table 3.6 µop Linear Regression Model Comparison .................................................. 31<br />
Table 3.7 Example P-states Definition .......................................................................... 33<br />
Table 3.8 Example C-states Definition ......................................................................... 34<br />
Table 3.9 AMD Quad-Core Power Model .................................................................... 39<br />
Table 4.1 Subsystem Power Standard Deviation (Watts) ............................................. 53<br />
Table 4.2 Coefficient of Variation ............................................................................... 54<br />
Table 4.3 Percent of Classifiable Samples .................................................................... 58<br />
Table 4.4 Workload Phase Classification ..................................................................... 59<br />
Table 5.1 Integer Average Model Error ........................................................................ 82<br />
Table 5.2 Floating Point Average Model Error............................................................. 83<br />
Table 5.3 System Comparison ...................................................................................... 85<br />
Table 5.4 Desktop Workloads ....................................................................................... 87<br />
Table 5.5 Average Error .............................................................................................. 101<br />
Table 6.1 Per<strong>for</strong>mance Loss Due to Low Idle Core Frequency – SPEC CPU 2006 .. 111<br />
Table 6.2 Power/Per<strong>for</strong>mance Study: SYSmark 2007 ................................................ 116<br />
xiii


