Copyright by William Lloyd Bircher 2010 - The Laboratory for ...
Copyright by William Lloyd Bircher 2010 - The Laboratory for ...
Copyright by William Lloyd Bircher 2010 - The Laboratory for ...

Create successful ePaper yourself
Turn your PDF publications into a flip-book with our unique Google optimized e-Paper software.
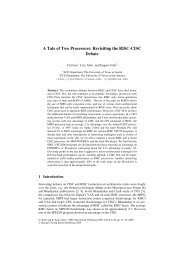
Core Power (Watts)<br />
60<br />
50<br />
40<br />
30<br />
20<br />
10<br />
Leakage<br />
Dynamic<br />
0<br />
35 50 65<br />
Die Temperature (Celsius)<br />
80 95<br />
Figure 3.2 Temperature Sensitivity of Leakage Power<br />
As expected, a linear change in frequency yields a linear change in power consumption.<br />
However, linear changes in temperature yield exponential changes in power<br />
consumption. Note that static power is identified <strong>by</strong> the Y-intercept in the chart. This is<br />
a critical observation since static power consumption represents a large portion of total<br />
power at high temperatures. <strong>The</strong>re<strong>for</strong>e, an effective power management scheme must<br />
also scale voltage to reduce the significant leakage component. To see the effect of<br />
voltage scaling consider Figure 3.3.<br />
Leakage power<br />
varies exponentially<br />
with temperature<br />
Dynamic power<br />
constant <strong>for</strong> fixed<br />
voltage and frequency<br />
Figure 3.3 shows the cumulative effect of p-states and c-states. Combinations of five p-<br />
states (x-axis) and four operating modes are shown. <strong>The</strong> lowest power case, C1e-Idle,<br />
represents all cores being idle <strong>for</strong> long enough that the processor remains in the C1e state<br />
more than 90 percent of the time. <strong>The</strong> actual amount of time spent in this state is heavily<br />
35