The Effects of Sanction Intensity on Criminal Conduct - JDAI Helpdesk
The Effects of Sanction Intensity on Criminal Conduct - JDAI Helpdesk
The Effects of Sanction Intensity on Criminal Conduct - JDAI Helpdesk

Create successful ePaper yourself
Turn your PDF publications into a flip-book with our unique Google optimized e-Paper software.
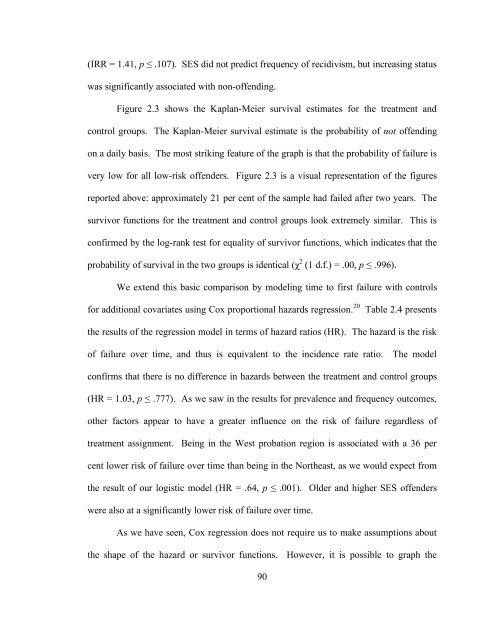
(IRR = 1.41, p ≤ .107). SES did not predict frequency <str<strong>on</strong>g>of</str<strong>on</strong>g> recidivism, but increasing status<br />
was significantly associated with n<strong>on</strong>-<str<strong>on</strong>g>of</str<strong>on</strong>g>fending.<br />
Figure 2.3 shows the Kaplan-Meier survival estimates for the treatment and<br />
c<strong>on</strong>trol groups. <str<strong>on</strong>g>The</str<strong>on</strong>g> Kaplan-Meier survival estimate is the probability <str<strong>on</strong>g>of</str<strong>on</strong>g> not <str<strong>on</strong>g>of</str<strong>on</strong>g>fending<br />
<strong>on</strong> a daily basis. <str<strong>on</strong>g>The</str<strong>on</strong>g> most striking feature <str<strong>on</strong>g>of</str<strong>on</strong>g> the graph is that the probability <str<strong>on</strong>g>of</str<strong>on</strong>g> failure is<br />
very low for all low-risk <str<strong>on</strong>g>of</str<strong>on</strong>g>fenders. Figure 2.3 is a visual representati<strong>on</strong> <str<strong>on</strong>g>of</str<strong>on</strong>g> the figures<br />
reported above: approximately 21 per cent <str<strong>on</strong>g>of</str<strong>on</strong>g> the sample had failed after two years. <str<strong>on</strong>g>The</str<strong>on</strong>g><br />
survivor functi<strong>on</strong>s for the treatment and c<strong>on</strong>trol groups look extremely similar. This is<br />
c<strong>on</strong>firmed by the log-rank test for equality <str<strong>on</strong>g>of</str<strong>on</strong>g> survivor functi<strong>on</strong>s, which indicates that the<br />
probability <str<strong>on</strong>g>of</str<strong>on</strong>g> survival in the two groups is identical (χ 2 (1 d.f.) = .00, p ≤ .996).<br />
We extend this basic comparis<strong>on</strong> by modeling time to first failure with c<strong>on</strong>trols<br />
for additi<strong>on</strong>al covariates using Cox proporti<strong>on</strong>al hazards regressi<strong>on</strong>. 20<br />
Table 2.4 presents<br />
the results <str<strong>on</strong>g>of</str<strong>on</strong>g> the regressi<strong>on</strong> model in terms <str<strong>on</strong>g>of</str<strong>on</strong>g> hazard ratios (HR). <str<strong>on</strong>g>The</str<strong>on</strong>g> hazard is the risk<br />
<str<strong>on</strong>g>of</str<strong>on</strong>g> failure over time, and thus is equivalent to the incidence rate ratio. <str<strong>on</strong>g>The</str<strong>on</strong>g> model<br />
c<strong>on</strong>firms that there is no difference in hazards between the treatment and c<strong>on</strong>trol groups<br />
(HR = 1.03, p ≤ .777). As we saw in the results for prevalence and frequency outcomes,<br />
other factors appear to have a greater influence <strong>on</strong> the risk <str<strong>on</strong>g>of</str<strong>on</strong>g> failure regardless <str<strong>on</strong>g>of</str<strong>on</strong>g><br />
treatment assignment. Being in the West probati<strong>on</strong> regi<strong>on</strong> is associated with a 36 per<br />
cent lower risk <str<strong>on</strong>g>of</str<strong>on</strong>g> failure over time than being in the Northeast, as we would expect from<br />
the result <str<strong>on</strong>g>of</str<strong>on</strong>g> our logistic model (HR = .64, p ≤ .001). Older and higher SES <str<strong>on</strong>g>of</str<strong>on</strong>g>fenders<br />
were also at a significantly lower risk <str<strong>on</strong>g>of</str<strong>on</strong>g> failure over time.<br />
As we have seen, Cox regressi<strong>on</strong> does not require us to make assumpti<strong>on</strong>s about<br />
the shape <str<strong>on</strong>g>of</str<strong>on</strong>g> the hazard or survivor functi<strong>on</strong>s. However, it is possible to graph the<br />
90