The Effects of Sanction Intensity on Criminal Conduct - JDAI Helpdesk
The Effects of Sanction Intensity on Criminal Conduct - JDAI Helpdesk
The Effects of Sanction Intensity on Criminal Conduct - JDAI Helpdesk
Create successful ePaper yourself
Turn your PDF publications into a flip-book with our unique Google optimized e-Paper software.
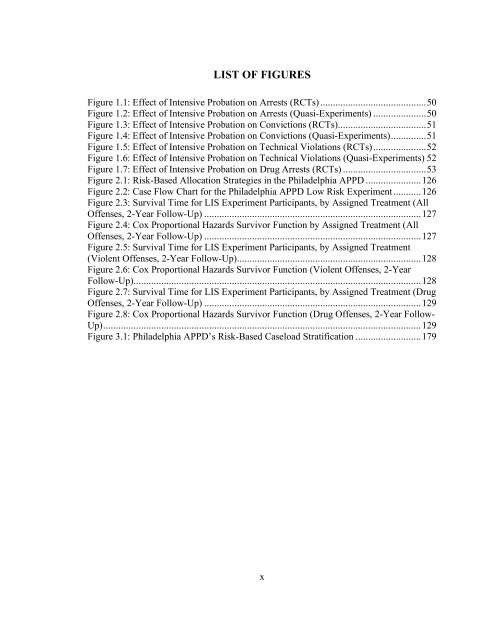
LIST OF FIGURES<br />
Figure 1.1: Effect <str<strong>on</strong>g>of</str<strong>on</strong>g> Intensive Probati<strong>on</strong> <strong>on</strong> Arrests (RCTs) ..........................................50<br />
Figure 1.2: Effect <str<strong>on</strong>g>of</str<strong>on</strong>g> Intensive Probati<strong>on</strong> <strong>on</strong> Arrests (Quasi-Experiments) .....................50<br />
Figure 1.3: Effect <str<strong>on</strong>g>of</str<strong>on</strong>g> Intensive Probati<strong>on</strong> <strong>on</strong> C<strong>on</strong>victi<strong>on</strong>s (RCTs)...................................51<br />
Figure 1.4: Effect <str<strong>on</strong>g>of</str<strong>on</strong>g> Intensive Probati<strong>on</strong> <strong>on</strong> C<strong>on</strong>victi<strong>on</strong>s (Quasi-Experiments)..............51<br />
Figure 1.5: Effect <str<strong>on</strong>g>of</str<strong>on</strong>g> Intensive Probati<strong>on</strong> <strong>on</strong> Technical Violati<strong>on</strong>s (RCTs).....................52<br />
Figure 1.6: Effect <str<strong>on</strong>g>of</str<strong>on</strong>g> Intensive Probati<strong>on</strong> <strong>on</strong> Technical Violati<strong>on</strong>s (Quasi-Experiments) 52<br />
Figure 1.7: Effect <str<strong>on</strong>g>of</str<strong>on</strong>g> Intensive Probati<strong>on</strong> <strong>on</strong> Drug Arrests (RCTs) .................................53<br />
Figure 2.1: Risk-Based Allocati<strong>on</strong> Strategies in the Philadelphia APPD ......................126<br />
Figure 2.2: Case Flow Chart for the Philadelphia APPD Low Risk Experiment...........126<br />
Figure 2.3: Survival Time for LIS Experiment Participants, by Assigned Treatment (All<br />
Offenses, 2-Year Follow-Up) ......................................................................................127<br />
Figure 2.4: Cox Proporti<strong>on</strong>al Hazards Survivor Functi<strong>on</strong> by Assigned Treatment (All<br />
Offenses, 2-Year Follow-Up) ......................................................................................127<br />
Figure 2.5: Survival Time for LIS Experiment Participants, by Assigned Treatment<br />
(Violent Offenses, 2-Year Follow-Up).........................................................................128<br />
Figure 2.6: Cox Proporti<strong>on</strong>al Hazards Survivor Functi<strong>on</strong> (Violent Offenses, 2-Year<br />
Follow-Up)..................................................................................................................128<br />
Figure 2.7: Survival Time for LIS Experiment Participants, by Assigned Treatment (Drug<br />
Offenses, 2-Year Follow-Up) ......................................................................................129<br />
Figure 2.8: Cox Proporti<strong>on</strong>al Hazards Survivor Functi<strong>on</strong> (Drug Offenses, 2-Year Follow-<br />
Up)..............................................................................................................................129<br />
Figure 3.1: Philadelphia APPD’s Risk-Based Caseload Stratificati<strong>on</strong> ..........................179<br />
x


