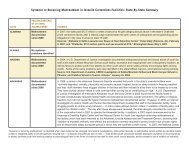
The Effects of Sanction Intensity on Criminal Conduct - JDAI Helpdesk
The Effects of Sanction Intensity on Criminal Conduct - JDAI Helpdesk
The Effects of Sanction Intensity on Criminal Conduct - JDAI Helpdesk

You also want an ePaper? Increase the reach of your titles
YUMPU automatically turns print PDFs into web optimized ePapers that Google loves.
isk backfill cases who were not randomly assigned but received LIS, and 1,000 predicted<br />
n<strong>on</strong>-low risk <str<strong>on</strong>g>of</str<strong>on</strong>g>fenders selected as part <str<strong>on</strong>g>of</str<strong>on</strong>g> a separate study.<br />
Our ‘full sample’ is a subset <str<strong>on</strong>g>of</str<strong>on</strong>g> all the groups that make up the 3,207-<str<strong>on</strong>g>of</str<strong>on</strong>g>fender<br />
dataset, divided into low and n<strong>on</strong>-low risk cases. Most <str<strong>on</strong>g>of</str<strong>on</strong>g> the backfill cases (N = 588) did<br />
not have a recorded reliability score from the predicti<strong>on</strong> model. Although we could<br />
assume that they were low risk because they were in the backfill group, they could not be<br />
used to examine the questi<strong>on</strong>s relating to the cut-<str<strong>on</strong>g>of</str<strong>on</strong>g>f point for a low risk predicti<strong>on</strong>, and<br />
we decided to exclude them from the analysis completely. In additi<strong>on</strong>, <strong>on</strong>e treatment<br />
group case had no recorded reliability score and was excluded from the full sample, but is<br />
included in the experimental sample. Finally, fifteen backfill cases had a reliability score<br />
between 0.49 and 0.5. We strictly followed the requirement for classifying cases with a<br />
reliability score <str<strong>on</strong>g>of</str<strong>on</strong>g> over 0.5 as low risk in this analysis, so those fifteen cases are<br />
classified as n<strong>on</strong>-low risk in the full sample. Thus, the full sample comprises 2,618<br />
<str<strong>on</strong>g>of</str<strong>on</strong>g>fenders in total: 1,603 predicted by the model to be low risk, and 1,015 predicted to be<br />
n<strong>on</strong>-low risk. Our ‘experimental sample’ c<strong>on</strong>sists <str<strong>on</strong>g>of</str<strong>on</strong>g> the 1,559 experimental participants,<br />
analyzed <strong>on</strong> an intenti<strong>on</strong>-to-treat basis (i.e., they remain in their assigned groups<br />
regardless <str<strong>on</strong>g>of</str<strong>on</strong>g> whether they actually received the assigned treatment).<br />
Tables 3.1 and 3.2 show basic demographic and <str<strong>on</strong>g>of</str<strong>on</strong>g>fending history characteristics<br />
for the two samples. Race is presented <strong>on</strong>ly as the proporti<strong>on</strong> <str<strong>on</strong>g>of</str<strong>on</strong>g> white <str<strong>on</strong>g>of</str<strong>on</strong>g>fenders because<br />
<str<strong>on</strong>g>of</str<strong>on</strong>g> problems in the recording <str<strong>on</strong>g>of</str<strong>on</strong>g> race in the original dataset, 8 which meant that it was <strong>on</strong>ly<br />
possible to reliably say whether the <str<strong>on</strong>g>of</str<strong>on</strong>g>fender was white or n<strong>on</strong>white. <str<strong>on</strong>g>The</str<strong>on</strong>g> mean age is<br />
calculated according to the <str<strong>on</strong>g>of</str<strong>on</strong>g>fender’s age (based <strong>on</strong> recorded date <str<strong>on</strong>g>of</str<strong>on</strong>g> birth) <strong>on</strong> October 1,<br />
2007. This was the date <strong>on</strong> which experimental participants were randomly assigned, and<br />
153