- Page 1 and 2:
University of Penn
- Page 3 and 4:
In memory of Edwar
- Page 5 and 6:
Janel McCaffrey and Knakiya Hagans,
- Page 7 and 8:
traditional practice, we find no ev
- Page 9 and 10:
Methodology .......................
- Page 11 and 12:
LIST OF FIGURES Figure 1.1: Effect
- Page 13 and 14:
intensity makes no difference to re
- Page 15 and 16:
isk of committing
- Page 17 and 18:
impact of probatio
- Page 19 and 20:
which perhaps suggests that ISP is
- Page 21 and 22:
program intended to reduce the stra
- Page 23 and 24:
supervision with probation
- Page 25 and 26:
3. To what extent do the risk/need
- Page 27 and 28:
Methods Scale (SMS: Farrington et a
- Page 29 and 30:
Types of Outcomes
- Page 31 and 32:
Description of met
- Page 33 and 34:
actual behavior. We analyze technic
- Page 35 and 36:
Treatment of quali
- Page 37 and 38:
treatment group, and those to the r
- Page 39 and 40:
Discussion of Resu
- Page 41 and 42:
were evaluated in the same report (
- Page 43 and 44:
direction of effec
- Page 45 and 46:
To what extent does program philoso
- Page 47 and 48:
Which other components of</
- Page 49 and 50:
.450; technical violations: Q B < .
- Page 51 and 52:
it should be noted that those progr
- Page 53 and 54:
up in unpublished reports than thos
- Page 55 and 56:
violations first went before a judg
- Page 57 and 58:
2 One U.S. estimate indicates that
- Page 59 and 60:
Tables Table 1.1: Characteristics <
- Page 61 and 62:
Table 1.3: Moderator Variable <stro
- Page 63 and 64:
Table 1.4: Moderator Variable <stro
- Page 65 and 66:
Figures Figure 1.1: Effect
- Page 67 and 68:
Figure 1.5: Effect of</stro
- Page 69 and 70:
CHAPTER 2. ‘Low-Intensity
- Page 71 and 72:
What Works in Probation Supervision
- Page 73 and 74:
to do with it. Furthermore, the mor
- Page 75 and 76:
to the New York City and Oregon stu
- Page 77 and 78:
Barnes et al. (forthcoming) have su
- Page 79 and 80:
paradox.” He suggests that ‘not
- Page 81 and 82:
fatal shootings in Philadelphia are
- Page 83 and 84: the proportions of
- Page 85 and 86: Interventions and Follow-Up Probati
- Page 87 and 88: officers more <str
- Page 89 and 90: 1. Does the effect of</stro
- Page 91 and 92: all, resulting in a large number <s
- Page 93 and 94: Differential treatment take-up and
- Page 95 and 96: control group members who received
- Page 97 and 98: effect of LIS on r
- Page 99 and 100: incarcerated must also be removed f
- Page 101 and 102: offenders in our s
- Page 103 and 104: ecidivists in the sample, 77 commit
- Page 105 and 106: (IRR = 1.41, p ≤ .107). SES did n
- Page 107 and 108: probability of fai
- Page 109 and 110: The count model ou
- Page 111 and 112: estimate is also practically identi
- Page 113 and 114: twice the risk of
- Page 115 and 116: an end. On the other hand, research
- Page 117 and 118: low-intensity supervision would imp
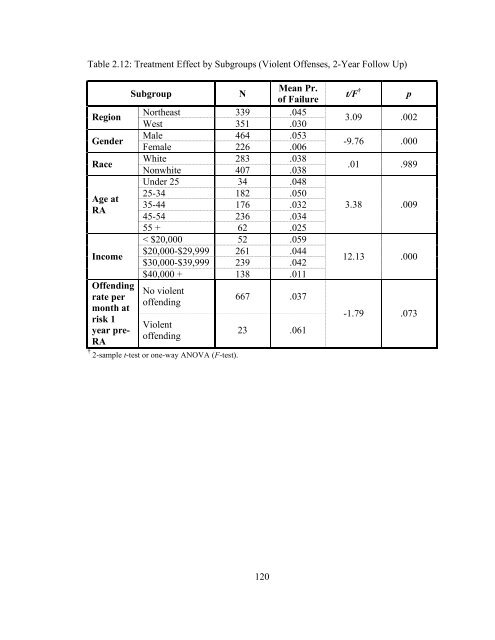
- Page 119 and 120: Conclusion The aim
- Page 121 and 122: We found that low-risk of</
- Page 123 and 124: 7 LIS participants who were transfe
- Page 125 and 126: Tables Table 2.1: Sample Characteri
- Page 127 and 128: Table 2.3: Frequency of</st
- Page 129 and 130: Table 2.5: Instrumental Variables M
- Page 131 and 132: Table 2.7: Prevalence of</s
- Page 133: Table 2.9: Time to Failure (Violent
- Page 137 and 138: Table 2.14: Frequency of</s
- Page 139 and 140: Table 2.16: Instrumental Variables
- Page 141 and 142: Figures Figure 2.1: Risk-Based Allo
- Page 143 and 144: Figure 2.5: Survival Time for LIS E
- Page 145 and 146: CHAPTER 3. Risk Prediction for Effe
- Page 147 and 148: sensitivity of the
- Page 149 and 150: Programs should be designed to adhe
- Page 151 and 152: weight information in an appropriat
- Page 153 and 154: statistical model that would predic
- Page 155 and 156: The Philadelphia m
- Page 157 and 158: assignment pool. Backfill probation
- Page 159 and 160: Little research has been done on th
- Page 161 and 162: already predicted to be at low risk
- Page 163 and 164: It assumes that if of</stro
- Page 165 and 166: involved. Crimes that obviously met
- Page 167 and 168: We examine the potential interactio
- Page 169 and 170: age is based on this date regardles
- Page 171 and 172: obberies. The only
- Page 173 and 174: of low-intensity s
- Page 175 and 176: classified as low risk. The
- Page 177 and 178: All the risk ratios in Table 3.9 in
- Page 179 and 180: 0.55. Raising the threshold results
- Page 181 and 182: are partly selected on the basis <s
- Page 183 and 184: make up the majority of</st
- Page 185 and 186:
strategy allows probation o
- Page 187 and 188:
Notes 1 In this study, murder, atte
- Page 189 and 190:
Table 3.2: Sample Characteristics (
- Page 191 and 192:
Table 3.6: Predictive Ability at Al
- Page 193 and 194:
Table 3.9: Post-Random Assignment O
- Page 195 and 196:
APPENDICES Appendix A: Systematic R
- Page 197 and 198:
combination. The s
- Page 199 and 200:
B. ELIGIBILITY CHECKLIST B1. First
- Page 201 and 202:
Other: txcxloth C6d. Additional pro
- Page 203 and 204:
D. SAMPLE LEVEL CODING SHEET Instru
- Page 205 and 206:
E. DEPENDENT VARIABLE CODING SHEET
- Page 207 and 208:
F14. Comparison group sample size f
- Page 209 and 210:
weight w is then recalculated (6),
- Page 211 and 212:
Study Sheffield (Males) 1976 (Folka
- Page 213 and 214:
Study Dallas TX 1992 (Turner & Pete
- Page 215 and 216:
Study Minnesota ISR 1995 (Deschenes
- Page 217 and 218:
Study Clark WA 2003 (Barnoski, 2003
- Page 219 and 220:
Study Whatcom WA 2003 (Barnoski, 20
- Page 221 and 222:
Study Los Angeles CA 2005 (Zhang &
- Page 223 and 224:
Fed. Prob., 56, 12-17. Turner, Pete
- Page 225 and 226:
Study Reference Benekos & Sonnenber
- Page 227 and 228:
Study Reference Giblin (2002) Using
- Page 229 and 230:
Study Reference Lasater et al. (n.d
- Page 231 and 232:
Study Reference Robertson (2000) Co
- Page 233 and 234:
Study Reference Turner & Greene (19
- Page 235 and 236:
Appendix E: Philadelphia APPD Low-<
- Page 237 and 238:
Prevalence of Reci
- Page 239 and 240:
Frequency of Recid
- Page 241 and 242:
Instrumental Variables Model: Preva
- Page 243 and 244:
Instrumental Variables Model: Preva
- Page 245 and 246:
Post-RA Months in Jail and Probabil
- Page 247 and 248:
Scaled Schoenfeld Residuals Time =
- Page 249 and 250:
BIBLIOGRAPHY Chapter 1 ** Denotes t
- Page 251 and 252:
Cook, T. D., & Campbell, D. T. (197
- Page 253 and 254:
Glaze, L. E, & Bonczar, T. P. (2009
- Page 255 and 256:
MacKenzie, D. L. (2006a). What work
- Page 257 and 258:
Petersilia, J., Turner, S., & Desch
- Page 259 and 260:
safety first: 13 strategies for suc
- Page 261 and 262:
Wilson, D. B. (2010). Meta-analysis
- Page 263 and 264:
Angrist, J. D. (2006). Instrumental
- Page 265 and 266:
Clear, T. R., & Hardyman, P. L. (19
- Page 267 and 268:
period266.pdf Lowenkamp, C. T., Lat
- Page 269 and 270:
Rosch, J. (2006). Deviant peer cont
- Page 271 and 272:
Taxman, F. S., & Thanner, M. (2006)
- Page 273 and 274:
statistical learning. Journal <stro
- Page 275 and 276:
Federal Bureau of
- Page 277 and 278:
Marsh, K., & Fox, C., (2008). <stro
- Page 279:
Sherman, L. W. (1993). Defiance, de