PIOJ Growth-Inducement Strategy - Planning Institute of Jamaica
PIOJ Growth-Inducement Strategy - Planning Institute of Jamaica
PIOJ Growth-Inducement Strategy - Planning Institute of Jamaica
You also want an ePaper? Increase the reach of your titles
YUMPU automatically turns print PDFs into web optimized ePapers that Google loves.
decline <strong>of</strong> 2.0 - 2.2 percentage points compared with 2010. 3<br />
predicated on the following assumptions:<br />
This baseline projection is<br />
1) Real GDP: Real GDP is projected to grow by 2.1% during FY2011/12, driven<br />
mainly by Mining & Quarrying, Hotels & Restaurants, Electricity & Water<br />
Supply, and Agriculture, Forestry & Fishing.<br />
2) Employment: Total employment level is projected to increase by 1.5 per cent;<br />
this increase is associated with expected growth in the following industries:<br />
Agriculture, Forestry & Fishing, Wholesale & Retail Trade, Repair and<br />
Installation <strong>of</strong> Machinery, all <strong>of</strong> which are labour-intensive industries.<br />
3) Remittance: Remittance is projected to increase as the global economy continues<br />
to record economic growth. Economic activities are also expected to improve in<br />
<strong>Jamaica</strong>’s main source <strong>of</strong> remittance, the USA.<br />
4) Pension: The increase in pension benefits from NIS (initiated in July 2010 and<br />
paid in December 2010), in addition to the announced increase in government<br />
workers’ pension, will positively impact disposable income and, thus, assist in<br />
reducing poverty in an age group (age 60 and over) where it is most prevalent.<br />
6.4 Under the improved growth scenario, the higher growth rates are projected to<br />
further reduce poverty rates to a range <strong>of</strong> 14.8%-16.4% (assuming a 3.7% growth rate)<br />
and 12.4% - 14.6% (assuming a 5.2% growth rate).<br />
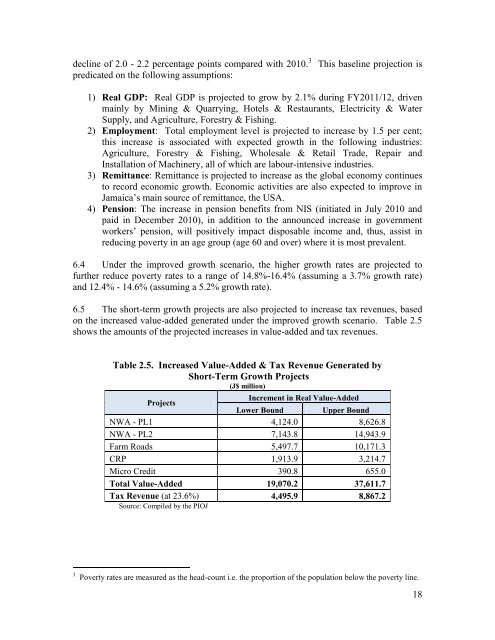
6.5 The short-term growth projects are also projected to increase tax revenues, based<br />
on the increased value-added generated under the improved growth scenario. Table 2.5<br />
shows the amounts <strong>of</strong> the projected increases in value-added and tax revenues.<br />
Table 2.5. Increased Value-Added & Tax Revenue Generated by<br />
Short-Term <strong>Growth</strong> Projects<br />
(J$ million)<br />
Projects<br />
Increment in Real Value-Added<br />
Lower Bound Upper Bound<br />
NWA - PL1 4,124.0 8,626.8<br />
NWA - PL2 7,143.8 14,943.9<br />
Farm Roads 5,497.7 10,171.3<br />
CRP 1,913.9 3,214.7<br />
Micro Credit 390.8 655.0<br />
Total Value-Added 19,070.2 37,611.7<br />
Tax Revenue (at 23.6%) 4,495.9 8,867.2<br />
Source: Compiled by the <strong>PIOJ</strong><br />
3 Poverty rates are measured as the head-count i.e. the proportion <strong>of</strong> the population below the poverty line.<br />
18


