PIOJ Growth-Inducement Strategy - Planning Institute of Jamaica
PIOJ Growth-Inducement Strategy - Planning Institute of Jamaica
PIOJ Growth-Inducement Strategy - Planning Institute of Jamaica

Create successful ePaper yourself
Turn your PDF publications into a flip-book with our unique Google optimized e-Paper software.
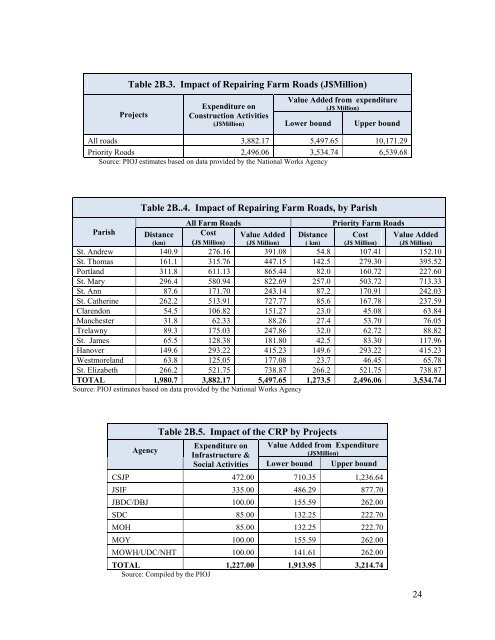
Table 2B.3. Impact <strong>of</strong> Repairing Farm Roads (J$Million)<br />
Projects<br />
Expenditure on<br />
Construction Activities<br />
(J$Million)<br />
Value Added from expenditure<br />
(J$ Million)<br />
Lower bound<br />
Upper bound<br />
All roads 3,882.17 5,497.65 10,171.29<br />
Priority Roads 2,496.06 3,534.74 6,539.68<br />
Source: <strong>PIOJ</strong> estimates based on data provided by the National Works Agency<br />
Parish<br />
Table 2B..4. Impact <strong>of</strong> Repairing Farm Roads, by Parish<br />
Distance<br />
(km)<br />
All Farm Roads<br />
Cost<br />
(J$ Million)<br />
Value Added<br />
(J$ Million)<br />
Distance<br />
( km)<br />
Priority Farm Roads<br />
Cost<br />
(J$ Million)<br />
Value Added<br />
(J$ Million)<br />
St. Andrew 140.9 276.16 391.08 54.8 107.41 152.10<br />
St. Thomas 161.1 315.76 447.15 142.5 279.30 395.52<br />
Portland 311.8 611.13 865.44 82.0 160.72 227.60<br />
St. Mary 296.4 580.94 822.69 257.0 503.72 713.33<br />
St. Ann 87.6 171.70 243.14 87.2 170.91 242.03<br />
St. Catherine 262.2 513.91 727.77 85.6 167.78 237.59<br />
Clarendon 54.5 106.82 151.27 23.0 45.08 63.84<br />
Manchester 31.8 62.33 88.26 27.4 53.70 76.05<br />
Trelawny 89.3 175.03 247.86 32.0 62.72 88.82<br />
St. James 65.5 128.38 181.80 42.5 83.30 117.96<br />
Hanover 149.6 293.22 415.23 149.6 293.22 415.23<br />
Westmoreland 63.8 125.05 177.08 23.7 46.45 65.78<br />
St. Elizabeth 266.2 521.75 738.87 266.2 521.75 738.87<br />
TOTAL 1,980.7 3,882.17 5,497.65 1,273.5 2,496.06 3,534.74<br />
Source: <strong>PIOJ</strong> estimates based on data provided by the National Works Agency<br />
Agency<br />
Table 2B.5. Impact <strong>of</strong> the CRP by Projects<br />
Expenditure on<br />
Infrastructure &<br />
Social Activities<br />
Value Added from Expenditure<br />
(J$Million)<br />
Lower bound Upper bound<br />
CSJP 472.00 710.35 1,236.64<br />
JSIF 335.00 486.29 877.70<br />
JBDC/DBJ 100.00 155.59 262.00<br />
SDC 85.00 132.25 222.70<br />
MOH 85.00 132.25 222.70<br />
MOY 100.00 155.59 262.00<br />
MOWH/UDC/NHT 100.00 141.61 262.00<br />
TOTAL 1,227.00 1,913.95 3,214.74<br />
Source: Compiled by the <strong>PIOJ</strong><br />
24