PIOJ Growth-Inducement Strategy - Planning Institute of Jamaica
PIOJ Growth-Inducement Strategy - Planning Institute of Jamaica
PIOJ Growth-Inducement Strategy - Planning Institute of Jamaica

Create successful ePaper yourself
Turn your PDF publications into a flip-book with our unique Google optimized e-Paper software.
Table 5.2. Percentage Change in World Bank’s Commodity Price Indices, 2008 – 2010<br />
2008 2009 2010<br />
Energy* 39.7 -37.3 26.5<br />
Non-Energy** 21.1 -21.6 26.5<br />
Grains 49.0 -23.7 0.4<br />
Metals & Minerals 3.7 -27.7 47.5<br />
* The Energy index incorporates prices for coal, crude oil and natural gas.<br />
** The Non-Energy index incorporates prices for agriculture, beverages, food, raw materials and fertilizers.<br />
Source: World Bank, Commodity Markets Review.<br />
Additional impetus for commodity prices resulted from: (i) increased investor confidence<br />
supported by the perception that the worst <strong>of</strong> the recession had passed; (ii) supply side<br />
shocks and production restraints; and (iii) severely cold winter weather. Price volatility<br />
during 2010 was influenced by financial investors who, through the use <strong>of</strong> futures<br />
contracts as financial instruments, bid up prices according to prospects for future<br />
shortages and exchange rate movements.<br />
Table 5.3. Selected Commodity Prices, Daily Movements, Half Year And Calendar Year Changes<br />
Commodity<br />
Daily Change<br />
Six Month Calendar Year<br />
Units 31-Dec-09 30-Jun-10 31-Dec-10 Change (%) Change (%)<br />
Aluminium US$/mt<br />
2208.00 1928.00 2461.00 -12.7 11.5<br />
Crude Oil US$/barrel<br />
77.56 74.70 89.84* -3.7 15.8<br />
Wheat<br />
US cents/bushel<br />
5.43 4.65 8.51 -14.4 56.7<br />
Rice (CBOT) US cents/bushel<br />
14.85 9.44 13.99 -36.4 -5.8<br />
Corn/Maize US cents/bushel 416.00 354.50 560.00 -14.7 34.6<br />
* Data available for December 30, 2010.<br />
Source: Data compiled from LME, EIA, CBOT.<br />
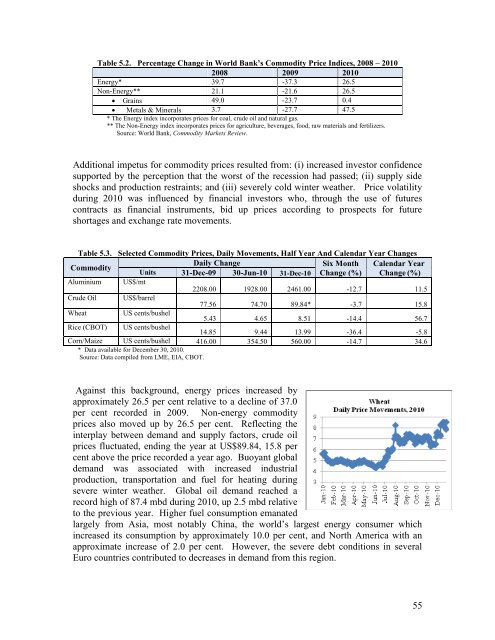
Against this background, energy prices increased by<br />
approximately 26.5 per cent relative to a decline <strong>of</strong> 37.0<br />
per cent recorded in 2009. Non-energy commodity<br />
prices also moved up by 26.5 per cent. Reflecting the<br />
interplay between demand and supply factors, crude oil<br />
prices fluctuated, ending the year at US$89.84, 15.8 per<br />
cent above the price recorded a year ago. Buoyant global<br />
demand was associated with increased industrial<br />
production, transportation and fuel for heating during<br />
severe winter weather. Global oil demand reached a<br />
record high <strong>of</strong> 87.4 mbd during 2010, up 2.5 mbd relative<br />
to the previous year. Higher fuel consumption emanated<br />
largely from Asia, most notably China, the world’s largest energy consumer which<br />
increased its consumption by approximately 10.0 per cent, and North America with an<br />
approximate increase <strong>of</strong> 2.0 per cent. However, the severe debt conditions in several<br />
Euro countries contributed to decreases in demand from this region.<br />
55