PIOJ Growth-Inducement Strategy - Planning Institute of Jamaica
PIOJ Growth-Inducement Strategy - Planning Institute of Jamaica
PIOJ Growth-Inducement Strategy - Planning Institute of Jamaica

You also want an ePaper? Increase the reach of your titles
YUMPU automatically turns print PDFs into web optimized ePapers that Google loves.
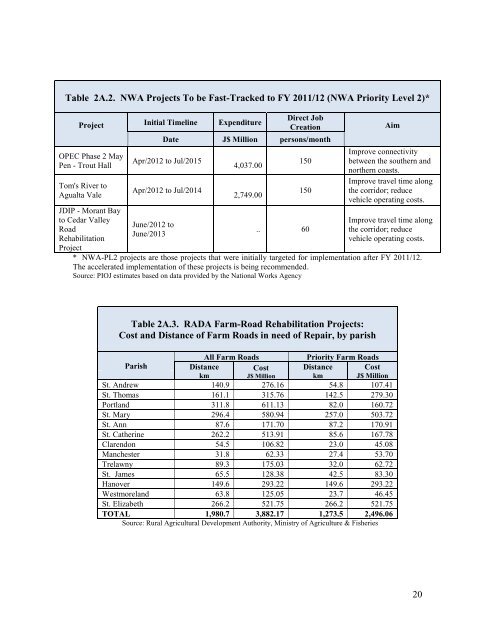
Table 2A.2. NWA Projects To be Fast-Tracked to FY 2011/12 (NWA Priority Level 2)*<br />
Project Initial Timeline Expenditure<br />
OPEC Phase 2 May<br />
Pen - Trout Hall<br />
Tom's River to<br />
Agualta Vale<br />
JDIP - Morant Bay<br />
to Cedar Valley<br />
Road<br />
Rehabilitation<br />
Project<br />
Direct Job<br />
Creation<br />
Date J$ Million persons/month<br />
Apr/2012 to Jul/2015<br />
Apr/2012 to Jul/2014<br />
June/2012 to<br />
June/2013<br />
4,037.00<br />
2,749.00<br />
150<br />
150<br />
.. 60<br />
Aim<br />
Improve connectivity<br />
between the southern and<br />
northern coasts.<br />
Improve travel time along<br />
the corridor; reduce<br />
vehicle operating costs.<br />
Improve travel time along<br />
the corridor; reduce<br />
vehicle operating costs.<br />
* NWA-PL2 projects are those projects that were initially targeted for implementation after FY 2011/12.<br />
The accelerated implementation <strong>of</strong> these projects is being recommended.<br />
Source: <strong>PIOJ</strong> estimates based on data provided by the National Works Agency<br />
Table 2A.3. RADA Farm-Road Rehabilitation Projects:<br />
Cost and Distance <strong>of</strong> Farm Roads in need <strong>of</strong> Repair, by parish<br />
All Farm Roads<br />
Priority Farm Roads<br />
Parish<br />
Distance<br />
km<br />
Cost<br />
J$ Million<br />
Distance<br />
km<br />
Cost<br />
J$ Million<br />
St. Andrew 140.9 276.16 54.8 107.41<br />
St. Thomas 161.1 315.76 142.5 279.30<br />
Portland 311.8 611.13 82.0 160.72<br />
St. Mary 296.4 580.94 257.0 503.72<br />
St. Ann 87.6 171.70 87.2 170.91<br />
St. Catherine 262.2 513.91 85.6 167.78<br />
Clarendon 54.5 106.82 23.0 45.08<br />
Manchester 31.8 62.33 27.4 53.70<br />
Trelawny 89.3 175.03 32.0 62.72<br />
St. James 65.5 128.38 42.5 83.30<br />
Hanover 149.6 293.22 149.6 293.22<br />
Westmoreland 63.8 125.05 23.7 46.45<br />
St. Elizabeth 266.2 521.75 266.2 521.75<br />
TOTAL 1,980.7 3,882.17 1,273.5 2,496.06<br />
Source: Rural Agricultural Development Authority, Ministry <strong>of</strong> Agriculture & Fisheries<br />
20