

Agilent Spectrum Analysis Basics - Agilent Technologies
Agilent Spectrum Analysis Basics - Agilent Technologies
Agilent Spectrum Analysis Basics - Agilent Technologies

Create successful ePaper yourself
Turn your PDF publications into a flip-book with our unique Google optimized e-Paper software.
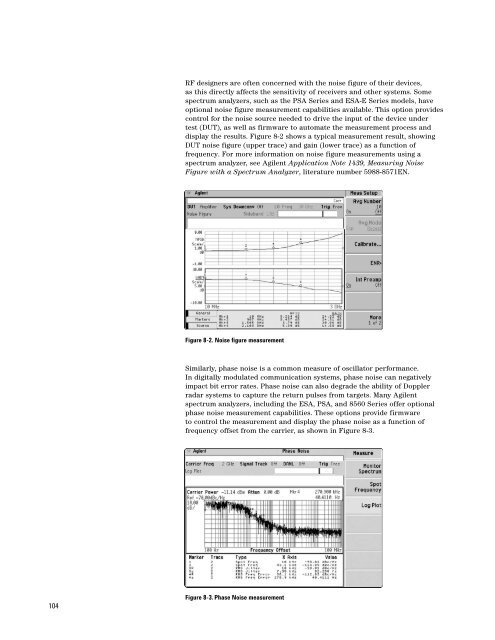
RF designers are often concerned with the noise figure of their devices,<br />
as this directly affects the sensitivity of receivers and other systems. Some<br />
spectrum analyzers, such as the PSA Series and ESA-E Series models, have<br />
optional noise figure measurement capabilities available. This option provides<br />
control for the noise source needed to drive the input of the device under<br />
test (DUT), as well as firmware to automate the measurement process and<br />
display the results. Figure 8-2 shows a typical measurement result, showing<br />
DUT noise figure (upper trace) and gain (lower trace) as a function of<br />
frequency. For more information on noise figure measurements using a<br />
spectrum analyzer, see <strong>Agilent</strong> Application Note 1439, Measuring Noise<br />
Figure with a <strong>Spectrum</strong> Analyzer, literature number 5988-8571EN.<br />
Figure 8-2. Noise figure measurement<br />
Similarly, phase noise is a common measure of oscillator performance.<br />
In digitally modulated communication systems, phase noise can negatively<br />
impact bit error rates. Phase noise can also degrade the ability of Doppler<br />
radar systems to capture the return pulses from targets. Many <strong>Agilent</strong><br />
spectrum analyzers, including the ESA, PSA, and 8560 Series offer optional<br />
phase noise measurement capabilities. These options provide firmware<br />
to control the measurement and display the phase noise as a function of<br />
frequency offset from the carrier, as shown in Figure 8-3.<br />
104<br />
Figure 8-3. Phase Noise measurement


