

Agilent Spectrum Analysis Basics - Agilent Technologies
Agilent Spectrum Analysis Basics - Agilent Technologies
Agilent Spectrum Analysis Basics - Agilent Technologies

Create successful ePaper yourself
Turn your PDF publications into a flip-book with our unique Google optimized e-Paper software.
Peak (positive) detection<br />
One way to insure that all sinusoids are reported at their true amplitudes is<br />
to display the maximum value encountered in each bucket. This is the positive<br />
peak detection mode, or peak. This is illustrated in Figure 2-22b. Peak is the<br />
default mode offered on many spectrum analyzers because it ensures that<br />
no sinusoid is missed, regardless of the ratio between resolution bandwidth<br />
and bucket width. However, unlike sample mode, peak does not give a good<br />
representation of random noise because it only displays the maximum value<br />
in each bucket and ignores the true randomness of the noise. So spectrum<br />
analyzers that use peak detection as their primary mode generally also offer<br />
the sample mode as an alternative.<br />
Negative peak detection<br />
Negative peak detection displays the minimum value encountered in each<br />
bucket. It is generally available in most spectrum analyzers, though it is not<br />
used as often as other types of detection. Differentiating CW from impulsive<br />
signals in EMC testing is one application where negative peak detection<br />
is valuable. Later in this application note, we will see how negative peak<br />
detection is also used in signal identification routines when using external<br />
mixers for high frequency measurements.<br />
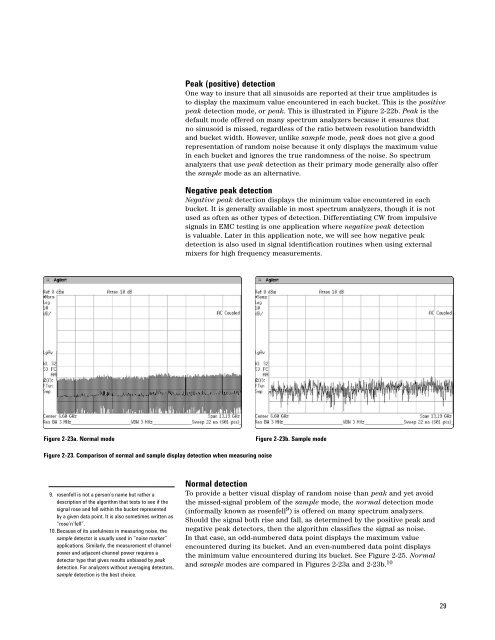
Figure 2-23a. Normal mode<br />
Figure 2-23b. Sample mode<br />
Figure 2-23. Comparison of normal and sample display detection when measuring noise<br />
9. rosenfell is not a person’s name but rather a<br />
description of the algorithm that tests to see if the<br />
signal rose and fell within the bucket represented<br />
by a given data point. It is also sometimes written as<br />
“rose’n’fell”.<br />
10. Because of its usefulness in measuring noise, the<br />
sample detector is usually used in “noise marker”<br />
applications. Similarly, the measurement of channel<br />
power and adjacent-channel power requires a<br />
detector type that gives results unbiased by peak<br />
detection. For analyzers without averaging detectors,<br />
sample detection is the best choice.<br />
Normal detection<br />
To provide a better visual display of random noise than peak and yet avoid<br />
the missed-signal problem of the sample mode, the normal detection mode<br />
(informally known as rosenfell 9 ) is offered on many spectrum analyzers.<br />
Should the signal both rise and fall, as determined by the positive peak and<br />
negative peak detectors, then the algorithm classifies the signal as noise.<br />
In that case, an odd-numbered data point displays the maximum value<br />
encountered during its bucket. And an even-numbered data point displays<br />
the minimum value encountered during its bucket. See Figure 2-25. Normal<br />
and sample modes are compared in Figures 2-23a and 2-23b. 10<br />
29


