

Agilent Spectrum Analysis Basics - Agilent Technologies
Agilent Spectrum Analysis Basics - Agilent Technologies
Agilent Spectrum Analysis Basics - Agilent Technologies

Create successful ePaper yourself
Turn your PDF publications into a flip-book with our unique Google optimized e-Paper software.
Using these expressions, we’ll see how a preamplifier affects our sensitivity.<br />
Assume that our spectrum analyzer has a noise figure of 24 dB and the<br />
preamplifier has a gain of 36 dB and a noise figure of 8 dB. All we need to<br />
do is to compare the gain plus noise figure of the preamplifier to the noise<br />
figure of the spectrum analyzer. The gain plus noise figure of the preamplifier<br />
is 44 dB, more than 15 dB higher than the noise figure of the spectrum<br />
analyzer, so the noise figure of the preamplifier/spectrum-analyzer<br />
combination is that of the preamplifier less 2.5 dB, or 5.5 dB. In a 10 kHz<br />
resolution bandwidth, our preamplifier/analyzer system has a sensitivity of:<br />
kTB B=1 + 10 log(RBW/1) + NF sys = –174 + 40 + 5.5<br />
= –128.5 dBm<br />
This is an improvement of 18.5 dB over the –110 dBm noise floor without the<br />
preamplifier.<br />
There might, however, be a drawback to using this preamplifier, depending<br />
upon our ultimate measurement objective. If we want the best sensitivity but<br />
no loss of measurement range, then this preamplifier is not the right choice.<br />
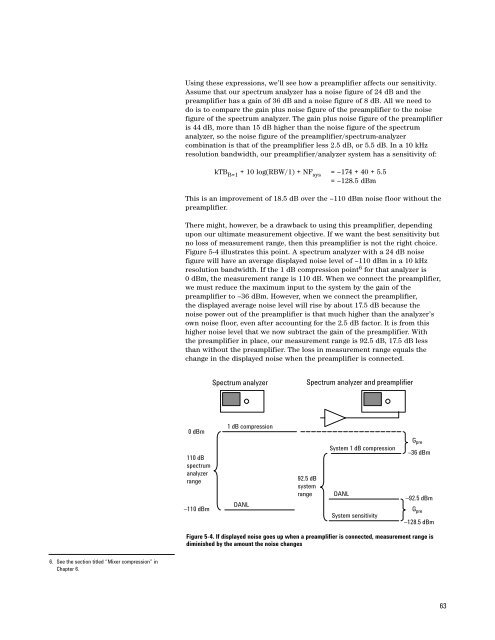
Figure 5-4 illustrates this point. A spectrum analyzer with a 24 dB noise<br />
figure will have an average displayed noise level of –110 dBm in a 10 kHz<br />
resolution bandwidth. If the 1 dB compression point 6 for that analyzer is<br />
0 dBm, the measurement range is 110 dB. When we connect the preamplifier,<br />
we must reduce the maximum input to the system by the gain of the<br />
preamplifier to –36 dBm. However, when we connect the preamplifier,<br />
the displayed average noise level will rise by about 17.5 dB because the<br />
noise power out of the preamplifier is that much higher than the analyzer’s<br />
own noise floor, even after accounting for the 2.5 dB factor. It is from this<br />
higher noise level that we now subtract the gain of the preamplifier. With<br />
the preamplifier in place, our measurement range is 92.5 dB, 17.5 dB less<br />
than without the preamplifier. The loss in measurement range equals the<br />
change in the displayed noise when the preamplifier is connected.<br />
<strong>Spectrum</strong> analyzer<br />
<strong>Spectrum</strong> analyzer and preamplifier<br />
0 dBm<br />
1 dB compression<br />
110 dB<br />
spectrum<br />
analyzer<br />
range<br />
–110 dBm<br />
DANL<br />
92.5 dB<br />
system<br />
range<br />
System 1 dB compression<br />
DANL<br />
System sensitivity<br />
G pre<br />
–36 dBm<br />
–92.5 dBm<br />
G pre<br />
–128.5 dBm<br />
Figure 5-4. If displayed noise goes up when a preamplifier is connected, measurement range is<br />
diminished by the amount the noise changes<br />
6. See the section titled “Mixer compression” in<br />
Chapter 6.<br />
63


