

Agilent Spectrum Analysis Basics - Agilent Technologies
Agilent Spectrum Analysis Basics - Agilent Technologies
Agilent Spectrum Analysis Basics - Agilent Technologies

Create successful ePaper yourself
Turn your PDF publications into a flip-book with our unique Google optimized e-Paper software.
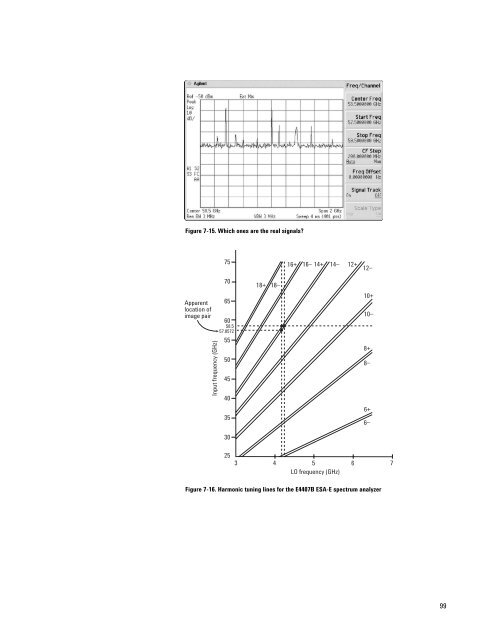
Figure 7-15. Which ones are the real signals?<br />
75<br />
16+ 16– 14+ 14–<br />
12+ 12–<br />
Apparent<br />
location of<br />
image pair<br />
Input frequency (GHz)<br />
70<br />
65<br />
60<br />
58.5<br />
57.8572<br />
55<br />
50<br />
45<br />
40<br />
35<br />
30<br />
18+ 18–<br />
10+<br />
10–<br />
8+<br />
8–<br />
6+<br />
6–<br />
25<br />
3 4<br />
5<br />
LO frequency (GHz)<br />
6<br />
7<br />
Figure 7-16. Harmonic tuning lines for the E4407B ESA-E spectrum analyzer<br />
99


