

Agilent Spectrum Analysis Basics - Agilent Technologies
Agilent Spectrum Analysis Basics - Agilent Technologies
Agilent Spectrum Analysis Basics - Agilent Technologies

Create successful ePaper yourself
Turn your PDF publications into a flip-book with our unique Google optimized e-Paper software.
<strong>Agilent</strong> data sheets describe the ability to resolve signals by listing the 3 dB<br />
bandwidths of the available IF filters. This number tells us how close together<br />
equal-amplitude sinusoids can be and still be resolved. In this case, there<br />
will be about a 3 dB dip between the two peaks traced out by these signals.<br />
See Figure 2-7. The signals can be closer together before their traces merge<br />
completely, but the 3 dB bandwidth is a good rule of thumb for resolution of<br />
equal-amplitude signals 3 .<br />
Figure 2-7. Two equal-amplitude sinusoids separated by the 3 dB BW<br />
of the selected IF filter can be resolved<br />
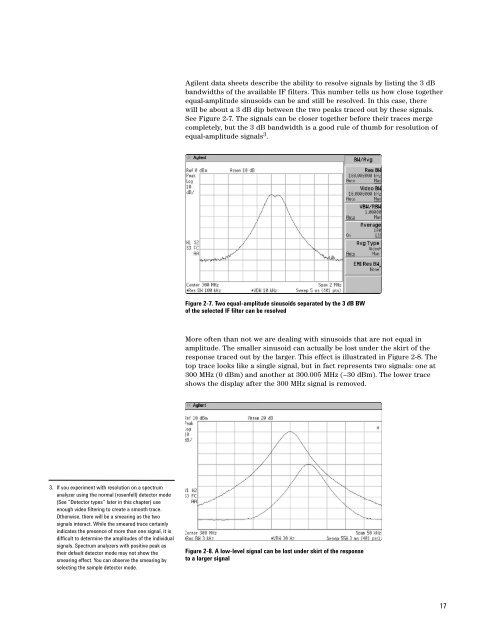
More often than not we are dealing with sinusoids that are not equal in<br />
amplitude. The smaller sinusoid can actually be lost under the skirt of the<br />
response traced out by the larger. This effect is illustrated in Figure 2-8. The<br />
top trace looks like a single signal, but in fact represents two signals: one at<br />
300 MHz (0 dBm) and another at 300.005 MHz (–30 dBm). The lower trace<br />
shows the display after the 300 MHz signal is removed.<br />
3. If you experiment with resolution on a spectrum<br />
analyzer using the normal (rosenfell) detector mode<br />
(See “Detector types” later in this chapter) use<br />
enough video filtering to create a smooth trace.<br />
Otherwise, there will be a smearing as the two<br />
signals interact. While the smeared trace certainly<br />
indicates the presence of more than one signal, it is<br />
difficult to determine the amplitudes of the individual<br />
signals. <strong>Spectrum</strong> analyzers with positive peak as<br />
their default detector mode may not show the<br />
smearing effect. You can observe the smearing by<br />
selecting the sample detector mode.<br />
Figure 2-8. A low-level signal can be lost under skirt of the response<br />
to a larger signal<br />
17


