

Agilent Spectrum Analysis Basics - Agilent Technologies
Agilent Spectrum Analysis Basics - Agilent Technologies
Agilent Spectrum Analysis Basics - Agilent Technologies

You also want an ePaper? Increase the reach of your titles
YUMPU automatically turns print PDFs into web optimized ePapers that Google loves.
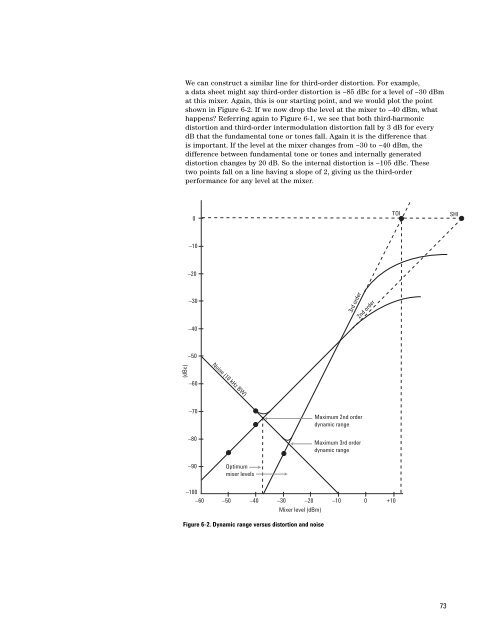
We can construct a similar line for third-order distortion. For example,<br />
a data sheet might say third-order distortion is –85 dBc for a level of –30 dBm<br />
at this mixer. Again, this is our starting point, and we would plot the point<br />
shown in Figure 6-2. If we now drop the level at the mixer to –40 dBm, what<br />
happens? Referring again to Figure 6-1, we see that both third-harmonic<br />
distortion and third-order intermodulation distortion fall by 3 dB for every<br />
dB that the fundamental tone or tones fall. Again it is the difference that<br />
is important. If the level at the mixer changes from –30 to –40 dBm, the<br />
difference between fundamental tone or tones and internally generated<br />
distortion changes by 20 dB. So the internal distortion is –105 dBc. These<br />
two points fall on a line having a slope of 2, giving us the third-order<br />
performance for any level at the mixer.<br />
0<br />
TOI<br />
SHI<br />
–10<br />
–20<br />
–30<br />
–40<br />
3rd order<br />
2nd order<br />
–50<br />
Noise (10 kHz BW)<br />
(dBc)<br />
–60<br />
–70<br />
–80<br />
Maximum 2nd order<br />
dynamic range<br />
Maximum 3rd order<br />
dynamic range<br />
–90<br />
Optimum<br />
mixer levels<br />
–100<br />
–60 –50 –40 –30 –20 –10 0 +10<br />
Mixer level (dBm)<br />
Figure 6-2. Dynamic range versus distortion and noise<br />
73


