

Agilent Spectrum Analysis Basics - Agilent Technologies
Agilent Spectrum Analysis Basics - Agilent Technologies
Agilent Spectrum Analysis Basics - Agilent Technologies

You also want an ePaper? Increase the reach of your titles
YUMPU automatically turns print PDFs into web optimized ePapers that Google loves.
Thus, the display gradually converges to an average over a number of sweeps.<br />
As with video filtering, we can select the degree of averaging or smoothing.<br />
We do this by setting the number of sweeps over which the averaging occurs.<br />
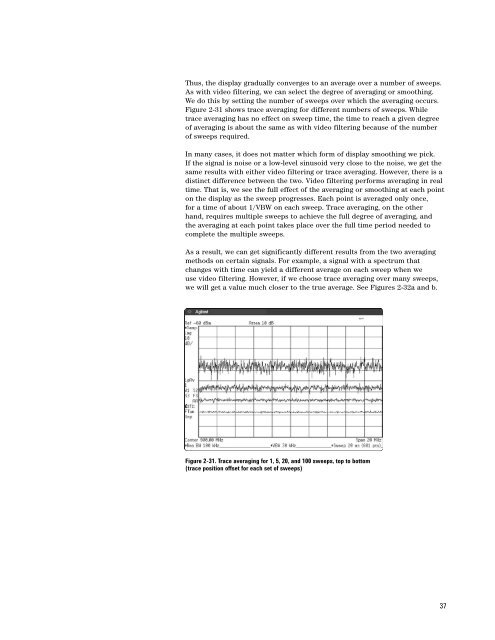
Figure 2-31 shows trace averaging for different numbers of sweeps. While<br />
trace averaging has no effect on sweep time, the time to reach a given degree<br />
of averaging is about the same as with video filtering because of the number<br />
of sweeps required.<br />
In many cases, it does not matter which form of display smoothing we pick.<br />
If the signal is noise or a low-level sinusoid very close to the noise, we get the<br />
same results with either video filtering or trace averaging. However, there is a<br />
distinct difference between the two. Video filtering performs averaging in real<br />
time. That is, we see the full effect of the averaging or smoothing at each point<br />
on the display as the sweep progresses. Each point is averaged only once,<br />
for a time of about 1/VBW on each sweep. Trace averaging, on the other<br />
hand, requires multiple sweeps to achieve the full degree of averaging, and<br />
the averaging at each point takes place over the full time period needed to<br />
complete the multiple sweeps.<br />
As a result, we can get significantly different results from the two averaging<br />
methods on certain signals. For example, a signal with a spectrum that<br />
changes with time can yield a different average on each sweep when we<br />
use video filtering. However, if we choose trace averaging over many sweeps,<br />
we will get a value much closer to the true average. See Figures 2-32a and b.<br />
Figure 2-31. Trace averaging for 1, 5, 20, and 100 sweeps, top to bottom<br />
(trace position offset for each set of sweeps)<br />
37


