

Agilent Spectrum Analysis Basics - Agilent Technologies
Agilent Spectrum Analysis Basics - Agilent Technologies
Agilent Spectrum Analysis Basics - Agilent Technologies

Create successful ePaper yourself
Turn your PDF publications into a flip-book with our unique Google optimized e-Paper software.
Because the input attenuator has no effect on the actual noise generated in<br />
the system, some early spectrum analyzers simply left the displayed noise<br />
at the same position on the display regardless of the input attenuator<br />
setting. That is, the IF gain remained constant. This being the case, the input<br />
attenuator affected the location of a true input signal on the display. As input<br />
attenuation was increased, further attenuating the input signal, the location<br />
of the signal on the display went down while the noise remained stationary.<br />
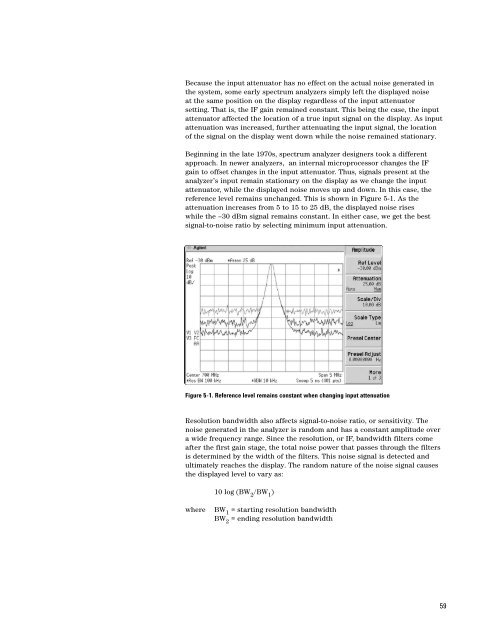
Beginning in the late 1970s, spectrum analyzer designers took a different<br />
approach. In newer analyzers, an internal microprocessor changes the IF<br />
gain to offset changes in the input attenuator. Thus, signals present at the<br />
analyzer’s input remain stationary on the display as we change the input<br />
attenuator, while the displayed noise moves up and down. In this case, the<br />
reference level remains unchanged. This is shown in Figure 5-1. As the<br />
attenuation increases from 5 to 15 to 25 dB, the displayed noise rises<br />
while the –30 dBm signal remains constant. In either case, we get the best<br />
signal-to-noise ratio by selecting minimum input attenuation.<br />
Figure 5-1. Reference level remains constant when changing input attenuation<br />
Resolution bandwidth also affects signal-to-noise ratio, or sensitivity. The<br />
noise generated in the analyzer is random and has a constant amplitude over<br />
a wide frequency range. Since the resolution, or IF, bandwidth filters come<br />
after the first gain stage, the total noise power that passes through the filters<br />
is determined by the width of the filters. This noise signal is detected and<br />
ultimately reaches the display. The random nature of the noise signal causes<br />
the displayed level to vary as:<br />
10 log (BW 2 /BW 1 )<br />
where<br />
BW 1 = starting resolution bandwidth<br />
BW 2 = ending resolution bandwidth<br />
59


