

Agilent Spectrum Analysis Basics - Agilent Technologies
Agilent Spectrum Analysis Basics - Agilent Technologies
Agilent Spectrum Analysis Basics - Agilent Technologies

Create successful ePaper yourself
Turn your PDF publications into a flip-book with our unique Google optimized e-Paper software.
1+<br />
Signal frequency (GHz)<br />
6<br />
5.3<br />
4.7<br />
4<br />
3<br />
2<br />
3<br />
Preselector<br />
bandwidth<br />
4 4.4 5 5.6<br />
LO frequency (GHz)<br />
1–<br />
6<br />
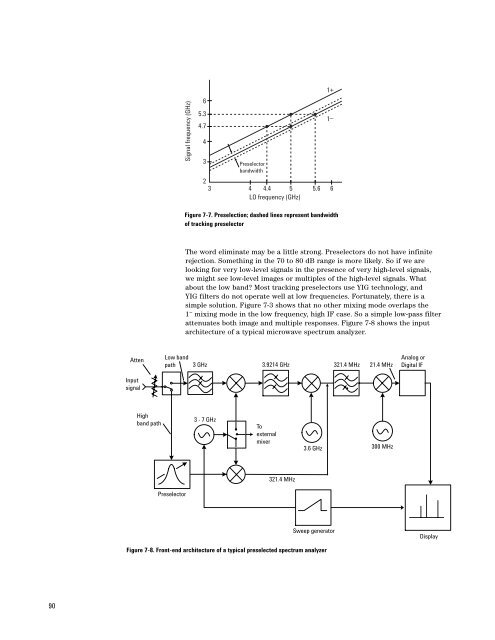
Figure 7-7. Preselection; dashed lines represent bandwidth<br />
of tracking preselector<br />
The word eliminate may be a little strong. Preselectors do not have infinite<br />
rejection. Something in the 70 to 80 dB range is more likely. So if we are<br />
looking for very low-level signals in the presence of very high-level signals,<br />
we might see low-level images or multiples of the high-level signals. What<br />
about the low band? Most tracking preselectors use YIG technology, and<br />
YIG filters do not operate well at low frequencies. Fortunately, there is a<br />
simple solution. Figure 7-3 shows that no other mixing mode overlaps the<br />
1 – mixing mode in the low frequency, high IF case. So a simple low-pass filter<br />
attenuates both image and multiple responses. Figure 7-8 shows the input<br />
architecture of a typical microwave spectrum analyzer.<br />
Atten<br />
Low band<br />
path<br />
3 GHz<br />
3.9214 GHz<br />
321.4 MHz 21.4 MHz<br />
Analog or<br />
Digital IF<br />
Input<br />
signal<br />
High<br />
band path<br />
3 - 7 GHz<br />
To<br />
external<br />
mixer<br />
3.6 GHz<br />
300 MHz<br />
321.4 MHz<br />
Preselector<br />
Sweep generator<br />
Display<br />
Figure 7-8. Front-end architecture of a typical preselected spectrum analyzer<br />
90


