Agilent Spectrum Analysis Basics - Agilent Technologies
Agilent Spectrum Analysis Basics - Agilent Technologies
Agilent Spectrum Analysis Basics - Agilent Technologies
You also want an ePaper? Increase the reach of your titles
YUMPU automatically turns print PDFs into web optimized ePapers that Google loves.
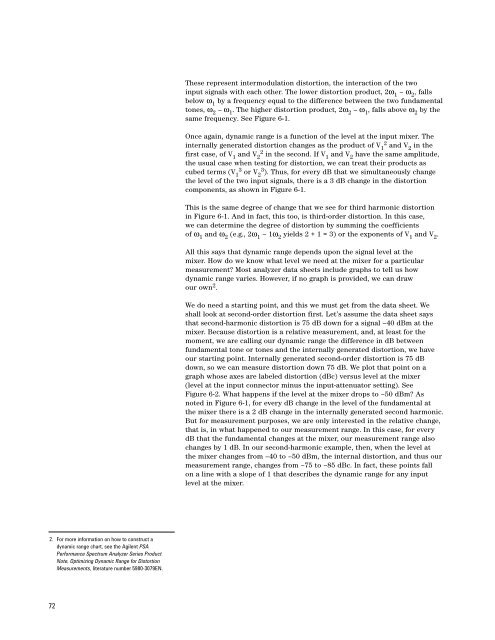
These represent intermodulation distortion, the interaction of the two<br />
input signals with each other. The lower distortion product, 2ω 1 – ω 2 , falls<br />
below ω 1 by a frequency equal to the difference between the two fundamental<br />
tones, ω 2 – ω 1 . The higher distortion product, 2ω 2 – ω 1 , falls above ω 2 by the<br />
same frequency. See Figure 6-1.<br />
Once again, dynamic range is a function of the level at the input mixer. The<br />
internally generated distortion changes as the product of V 1 2 and V 2 in the<br />
first case, of V 1 and V 2 2 in the second. If V 1 and V 2 have the same amplitude,<br />
the usual case when testing for distortion, we can treat their products as<br />
cubed terms (V 1 3 or V 2 3 ). Thus, for every dB that we simultaneously change<br />
the level of the two input signals, there is a 3 dB change in the distortion<br />
components, as shown in Figure 6-1.<br />
This is the same degree of change that we see for third harmonic distortion<br />
in Figure 6-1. And in fact, this too, is third-order distortion. In this case,<br />
we can determine the degree of distortion by summing the coefficients<br />
of ω 1 and ω 2 (e.g., 2ω 1 – 1ω 2 yields 2 + 1 = 3) or the exponents of V 1 and V 2 .<br />
All this says that dynamic range depends upon the signal level at the<br />
mixer. How do we know what level we need at the mixer for a particular<br />
measurement? Most analyzer data sheets include graphs to tell us how<br />
dynamic range varies. However, if no graph is provided, we can draw<br />
our own 2 .<br />
We do need a starting point, and this we must get from the data sheet. We<br />
shall look at second-order distortion first. Let’s assume the data sheet says<br />
that second-harmonic distortion is 75 dB down for a signal –40 dBm at the<br />
mixer. Because distortion is a relative measurement, and, at least for the<br />
moment, we are calling our dynamic range the difference in dB between<br />
fundamental tone or tones and the internally generated distortion, we have<br />
our starting point. Internally generated second-order distortion is 75 dB<br />
down, so we can measure distortion down 75 dB. We plot that point on a<br />
graph whose axes are labeled distortion (dBc) versus level at the mixer<br />
(level at the input connector minus the input-attenuator setting). See<br />
Figure 6-2. What happens if the level at the mixer drops to –50 dBm? As<br />
noted in Figure 6-1, for every dB change in the level of the fundamental at<br />
the mixer there is a 2 dB change in the internally generated second harmonic.<br />
But for measurement purposes, we are only interested in the relative change,<br />
that is, in what happened to our measurement range. In this case, for every<br />
dB that the fundamental changes at the mixer, our measurement range also<br />
changes by 1 dB. In our second-harmonic example, then, when the level at<br />
the mixer changes from –40 to –50 dBm, the internal distortion, and thus our<br />
measurement range, changes from –75 to –85 dBc. In fact, these points fall<br />
on a line with a slope of 1 that describes the dynamic range for any input<br />
level at the mixer.<br />
2. For more information on how to construct a<br />
dynamic range chart, see the <strong>Agilent</strong> PSA<br />
Performance <strong>Spectrum</strong> Analyzer Series Product<br />
Note, Optimizing Dynamic Range for Distortion<br />
Measurements, literature number 5980-3079EN.<br />
72


