

Agilent Spectrum Analysis Basics - Agilent Technologies
Agilent Spectrum Analysis Basics - Agilent Technologies
Agilent Spectrum Analysis Basics - Agilent Technologies

Create successful ePaper yourself
Turn your PDF publications into a flip-book with our unique Google optimized e-Paper software.
Finding a preamplifier that will give us better sensitivity without costing<br />
us measurement range dictates that we must meet the second of the above<br />
criteria; that is, the sum of its gain and noise figure must be at least 10 dB<br />
less than the noise figure of the spectrum analyzer. In this case the displayed<br />
noise floor will not change noticeably when we connect the preamplifier,<br />
so although we shift the whole measurement range down by the gain of the<br />
preamplifier, we end up with the same overall range that we started with.<br />
To choose the correct preamplifier, we must look at our measurement needs.<br />
If we want absolutely the best sensitivity and are not concerned about<br />
measurement range, we would choose a high-gain, low-noise-figure<br />
preamplifier so that our system would take on the noise figure of the<br />
preamplifier, less 2.5 dB. If we want better sensitivity but cannot afford to<br />
give up any measurement range, we must choose a lower-gain preamplifier.<br />
Interestingly enough, we can use the input attenuator of the spectrum analyzer<br />
to effectively degrade the noise figure (or reduce the gain of the preamplifier,<br />
if you prefer). For example, if we need slightly better sensitivity but cannot<br />
afford to give up any measurement range, we can use the above preamplifier<br />
with 30 dB of RF input attenuation on the spectrum analyzer. This attenuation<br />
increases the noise figure of the analyzer from 24 to 54 dB. Now the gain plus<br />
noise figure of the preamplifier (36 + 8) is 10 dB less than the noise figure of<br />
the analyzer, and we have met the conditions of the second criterion above.<br />
The noise figure of the system is now:<br />
NFsys<br />
= NF SA – G PRE<br />
= 54 dB – 36 dB<br />
= 18 dB<br />
This represents a 6 dB improvement over the noise figure of the analyzer<br />
alone with 0 dB of input attenuation. So we have improved sensitivity by 6 dB<br />
and given up virtually no measurement range.<br />
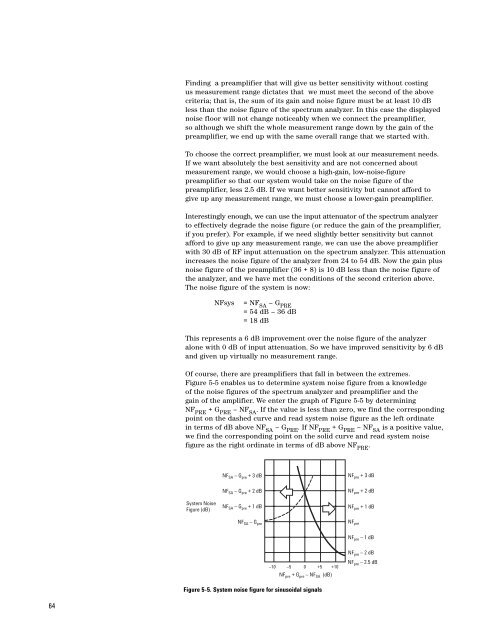
Of course, there are preamplifiers that fall in between the extremes.<br />
Figure 5-5 enables us to determine system noise figure from a knowledge<br />
of the noise figures of the spectrum analyzer and preamplifier and the<br />
gain of the amplifier. We enter the graph of Figure 5-5 by determining<br />
NF PRE + G PRE – NF SA . If the value is less than zero, we find the corresponding<br />
point on the dashed curve and read system noise figure as the left ordinate<br />
in terms of dB above NF SA – G PRE . If NF PRE + G PRE – NF SA is a positive value,<br />
we find the corresponding point on the solid curve and read system noise<br />
figure as the right ordinate in terms of dB above NF PRE .<br />
NF SA – G pre + 3 dB<br />
NF pre + 3 dB<br />
System Noise<br />
Figure (dB)<br />
NF SA – G pre + 2 dB<br />
NF SA – G pre + 1 dB<br />
NF pre + 2 dB<br />
NF pre + 1 dB<br />
NF SA – G pre<br />
NF pre<br />
NF pre – 1 dB<br />
NF pre – 2 dB<br />
–10 –5 0 +5 +10<br />
NF pre + G pre – NF SA (dB)<br />
NF pre – 2.5 dB<br />
Figure 5-5. System noise figure for sinusoidal signals<br />
64


