

Agilent Spectrum Analysis Basics - Agilent Technologies
Agilent Spectrum Analysis Basics - Agilent Technologies
Agilent Spectrum Analysis Basics - Agilent Technologies

You also want an ePaper? Increase the reach of your titles
YUMPU automatically turns print PDFs into web optimized ePapers that Google loves.
The range of the log amplifier can be another limitation for spectrum<br />
analyzers with analog IF circuitry. For example, ESA-L Series spectrum<br />
analyzers use an 85 dB log amplifier. Thus, only measurements that are within<br />
85 dB below the reference level are calibrated.<br />
The question is, can the full display range be used? From the previous<br />
discussion of dynamic range, we know that the answer is generally yes. In fact,<br />
dynamic range often exceeds display range or log amplifier range. To bring<br />
the smaller signals into the calibrated area of the display, we must increase<br />
IF gain. But in so doing, we may move the larger signals off the top of the<br />
display, above the reference level. Some <strong>Agilent</strong> analyzers, such as the<br />
PSA Series, allow measurements of signals above the reference level without<br />
affecting the accuracy with which the smaller signals are displayed. This is<br />
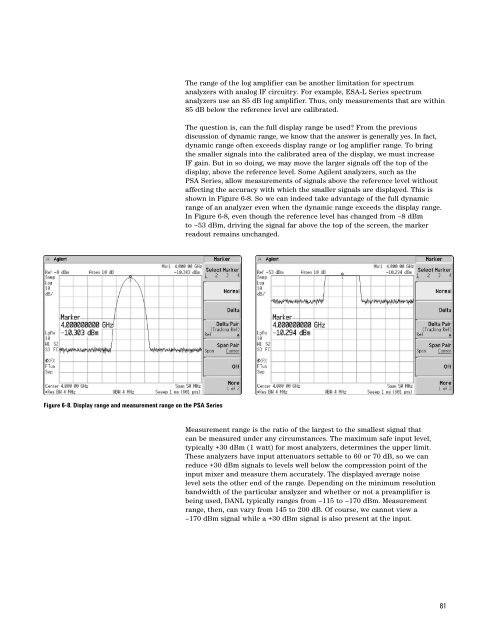
shown in Figure 6-8. So we can indeed take advantage of the full dynamic<br />
range of an analyzer even when the dynamic range exceeds the display range.<br />
In Figure 6-8, even though the reference level has changed from –8 dBm<br />
to –53 dBm, driving the signal far above the top of the screen, the marker<br />
readout remains unchanged.<br />
Figure 6-8. Display range and measurement range on the PSA Series<br />
Measurement range is the ratio of the largest to the smallest signal that<br />
can be measured under any circumstances. The maximum safe input level,<br />
typically +30 dBm (1 watt) for most analyzers, determines the upper limit.<br />
These analyzers have input attenuators settable to 60 or 70 dB, so we can<br />
reduce +30 dBm signals to levels well below the compression point of the<br />
input mixer and measure them accurately. The displayed average noise<br />
level sets the other end of the range. Depending on the minimum resolution<br />
bandwidth of the particular analyzer and whether or not a preamplifier is<br />
being used, DANL typically ranges from –115 to –170 dBm. Measurement<br />
range, then, can vary from 145 to 200 dB. Of course, we cannot view a<br />
–170 dBm signal while a +30 dBm signal is also present at the input.<br />
81


