Agilent Spectrum Analysis Basics - Agilent Technologies
Agilent Spectrum Analysis Basics - Agilent Technologies
Agilent Spectrum Analysis Basics - Agilent Technologies
You also want an ePaper? Increase the reach of your titles
YUMPU automatically turns print PDFs into web optimized ePapers that Google loves.
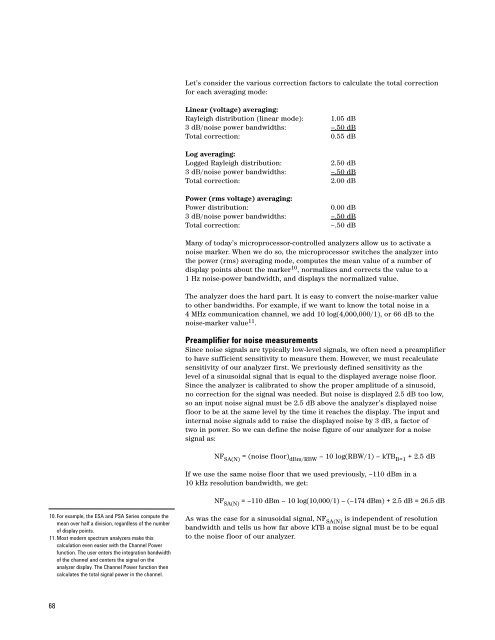
Let’s consider the various correction factors to calculate the total correction<br />
for each averaging mode:<br />
Linear (voltage) averaging:<br />
Rayleigh distribution (linear mode): 1.05 dB<br />
3 dB/noise power bandwidths: –.50 dB<br />
Total correction:<br />
0.55 dB<br />
Log averaging:<br />
Logged Rayleigh distribution:<br />
2.50 dB<br />
3 dB/noise power bandwidths: –.50 dB<br />
Total correction:<br />
2.00 dB<br />
Power (rms voltage) averaging:<br />
Power distribution:<br />
0.00 dB<br />
3 dB/noise power bandwidths: –.50 dB<br />
Total correction:<br />
–.50 dB<br />
Many of today’s microprocessor-controlled analyzers allow us to activate a<br />
noise marker. When we do so, the microprocessor switches the analyzer into<br />
the power (rms) averaging mode, computes the mean value of a number of<br />
display points about the marker 10 , normalizes and corrects the value to a<br />
1 Hz noise-power bandwidth, and displays the normalized value.<br />
The analyzer does the hard part. It is easy to convert the noise-marker value<br />
to other bandwidths. For example, if we want to know the total noise in a<br />
4 MHz communication channel, we add 10 log(4,000,000/1), or 66 dB to the<br />
noise-marker value 11 .<br />
Preamplifier for noise measurements<br />
Since noise signals are typically low-level signals, we often need a preamplifier<br />
to have sufficient sensitivity to measure them. However, we must recalculate<br />
sensitivity of our analyzer first. We previously defined sensitivity as the<br />
level of a sinusoidal signal that is equal to the displayed average noise floor.<br />
Since the analyzer is calibrated to show the proper amplitude of a sinusoid,<br />
no correction for the signal was needed. But noise is displayed 2.5 dB too low,<br />
so an input noise signal must be 2.5 dB above the analyzer’s displayed noise<br />
floor to be at the same level by the time it reaches the display. The input and<br />
internal noise signals add to raise the displayed noise by 3 dB, a factor of<br />
two in power. So we can define the noise figure of our analyzer for a noise<br />
signal as:<br />
NF SA(N) = (noise floor) dBm/RBW – 10 log(RBW/1) – kTB B=1 + 2.5 dB<br />
If we use the same noise floor that we used previously, –110 dBm in a<br />
10 kHz resolution bandwidth, we get:<br />
NF SA(N) = –110 dBm – 10 log(10,000/1) – (–174 dBm) + 2.5 dB = 26.5 dB<br />
10. For example, the ESA and PSA Series compute the<br />
mean over half a division, regardless of the number<br />
of display points.<br />
11. Most modern spectrum analyzers make this<br />
calculation even easier with the Channel Power<br />
function. The user enters the integration bandwidth<br />
of the channel and centers the signal on the<br />
analyzer display. The Channel Power function then<br />
calculates the total signal power in the channel.<br />
As was the case for a sinusoidal signal, NF SA(N) is independent of resolution<br />
bandwidth and tells us how far above kTB a noise signal must be to be equal<br />
to the noise floor of our analyzer.<br />
68


