

Agilent Spectrum Analysis Basics - Agilent Technologies
Agilent Spectrum Analysis Basics - Agilent Technologies
Agilent Spectrum Analysis Basics - Agilent Technologies

You also want an ePaper? Increase the reach of your titles
YUMPU automatically turns print PDFs into web optimized ePapers that Google loves.
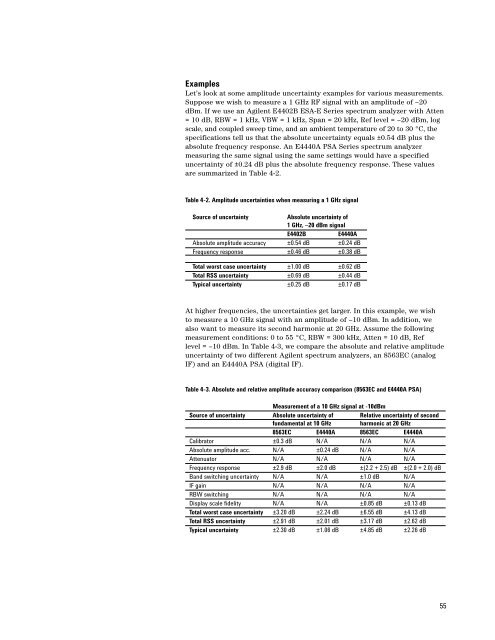
Examples<br />
Let’s look at some amplitude uncertainty examples for various measurements.<br />
Suppose we wish to measure a 1 GHz RF signal with an amplitude of –20<br />
dBm. If we use an <strong>Agilent</strong> E4402B ESA-E Series spectrum analyzer with Atten<br />
= 10 dB, RBW = 1 kHz, VBW = 1 kHz, Span = 20 kHz, Ref level = –20 dBm, log<br />
scale, and coupled sweep time, and an ambient temperature of 20 to 30 °C, the<br />
specifications tell us that the absolute uncertainty equals ±0.54 dB plus the<br />
absolute frequency response. An E4440A PSA Series spectrum analyzer<br />
measuring the same signal using the same settings would have a specified<br />
uncertainty of ±0.24 dB plus the absolute frequency response. These values<br />
are summarized in Table 4-2.<br />
Table 4-2. Amplitude uncertainties when measuring a 1 GHz signal<br />
Source of uncertainty<br />
Absolute uncertainty of<br />
1 GHz, –20 dBm signal<br />
E4402B<br />
E4440A<br />
Absolute amplitude accuracy ±0.54 dB ±0.24 dB<br />
Frequency response ±0.46 dB ±0.38 dB<br />
Total worst case uncertainty ±1.00 dB ±0.62 dB<br />
Total RSS uncertainty ±0.69 dB ±0.44 dB<br />
Typical uncertainty ±0.25 dB ±0.17 dB<br />
At higher frequencies, the uncertainties get larger. In this example, we wish<br />
to measure a 10 GHz signal with an amplitude of –10 dBm. In addition, we<br />
also want to measure its second harmonic at 20 GHz. Assume the following<br />
measurement conditions: 0 to 55 °C, RBW = 300 kHz, Atten = 10 dB, Ref<br />
level = –10 dBm. In Table 4-3, we compare the absolute and relative amplitude<br />
uncertainty of two different <strong>Agilent</strong> spectrum analyzers, an 8563EC (analog<br />
IF) and an E4440A PSA (digital IF).<br />
Table 4-3. Absolute and relative amplitude accuracy comparison (8563EC and E4440A PSA)<br />
Measurement of a 10 GHz signal at -10dBm<br />
Source of uncertainty Absolute uncertainty of Relative uncertainty of second<br />
fundamental at 10 GHz harmonic at 20 GHz<br />
8563EC E4440A 8563EC E4440A<br />
Calibrator ±0.3 dB N/A N/A N/A<br />
Absolute amplitude acc. N/A ±0.24 dB N/A N/A<br />
Attenuator N/A N/A N/A N/A<br />
Frequency response ±2.9 dB ±2.0 dB ±(2.2 + 2.5) dB ±(2.0 + 2.0) dB<br />
Band switching uncertainty N/A N/A ±1.0 dB N/A<br />
IF gain N/A N/A N/A N/A<br />
RBW switching N/A N/A N/A N/A<br />
Display scale fidelity N/A N/A ±0.85 dB ±0.13 dB<br />
Total worst case uncertainty ±3.20 dB ±2.24 dB ±6.55 dB ±4.13 dB<br />
Total RSS uncertainty ±2.91 dB ±2.01 dB ±3.17 dB ±2.62 dB<br />
Typical uncertainty ±2.30 dB ±1.06 dB ±4.85 dB ±2.26 dB<br />
55


