Agilent Spectrum Analysis Basics - Agilent Technologies
Agilent Spectrum Analysis Basics - Agilent Technologies
Agilent Spectrum Analysis Basics - Agilent Technologies
Create successful ePaper yourself
Turn your PDF publications into a flip-book with our unique Google optimized e-Paper software.
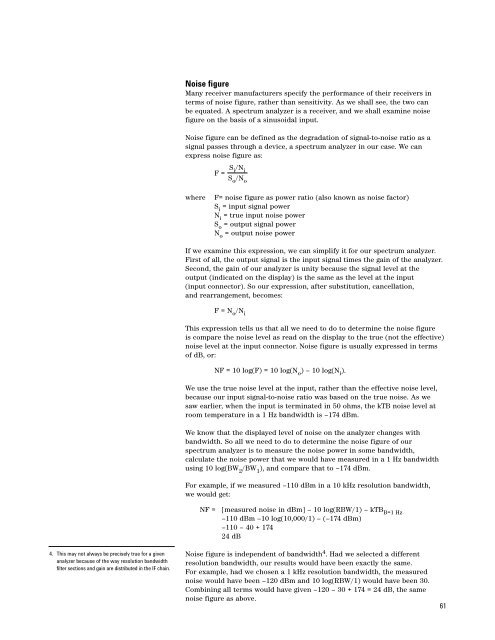
Noise figure<br />
Many receiver manufacturers specify the performance of their receivers in<br />
terms of noise figure, rather than sensitivity. As we shall see, the two can<br />
be equated. A spectrum analyzer is a receiver, and we shall examine noise<br />
figure on the basis of a sinusoidal input.<br />
Noise figure can be defined as the degradation of signal-to-noise ratio as a<br />
signal passes through a device, a spectrum analyzer in our case. We can<br />
express noise figure as:<br />
F = S i /N i<br />
S o /N o<br />
where<br />
F= noise figure as power ratio (also known as noise factor)<br />
S i = input signal power<br />
N i = true input noise power<br />
S o = output signal power<br />
N o = output noise power<br />
If we examine this expression, we can simplify it for our spectrum analyzer.<br />
First of all, the output signal is the input signal times the gain of the analyzer.<br />
Second, the gain of our analyzer is unity because the signal level at the<br />
output (indicated on the display) is the same as the level at the input<br />
(input connector). So our expression, after substitution, cancellation,<br />
and rearrangement, becomes:<br />
F = N o /N i<br />
This expression tells us that all we need to do to determine the noise figure<br />
is compare the noise level as read on the display to the true (not the effective)<br />
noise level at the input connector. Noise figure is usually expressed in terms<br />
of dB, or:<br />
NF = 10 log(F) = 10 log(N o ) – 10 log(N i ).<br />
We use the true noise level at the input, rather than the effective noise level,<br />
because our input signal-to-noise ratio was based on the true noise. As we<br />
saw earlier, when the input is terminated in 50 ohms, the kTB noise level at<br />
room temperature in a 1 Hz bandwidth is –174 dBm.<br />
We know that the displayed level of noise on the analyzer changes with<br />
bandwidth. So all we need to do to determine the noise figure of our<br />
spectrum analyzer is to measure the noise power in some bandwidth,<br />
calculate the noise power that we would have measured in a 1 Hz bandwidth<br />
using 10 log(BW 2 /BW 1 ), and compare that to –174 dBm.<br />
For example, if we measured –110 dBm in a 10 kHz resolution bandwidth,<br />
we would get:<br />
NF =<br />
[measured noise in dBm] – 10 log(RBW/1) – kTB B=1 Hz<br />
–110 dBm –10 log(10,000/1) – (–174 dBm)<br />
–110 – 40 + 174<br />
24 dB<br />
4. This may not always be precisely true for a given<br />
analyzer because of the way resolution bandwidth<br />
filter sections and gain are distributed in the IF chain.<br />
Noise figure is independent of bandwidth 4 . Had we selected a different<br />
resolution bandwidth, our results would have been exactly the same.<br />
For example, had we chosen a 1 kHz resolution bandwidth, the measured<br />
noise would have been –120 dBm and 10 log(RBW/1) would have been 30.<br />
Combining all terms would have given –120 – 30 + 174 = 24 dB, the same<br />
noise figure as above.<br />
61


