

Agilent Spectrum Analysis Basics - Agilent Technologies
Agilent Spectrum Analysis Basics - Agilent Technologies
Agilent Spectrum Analysis Basics - Agilent Technologies

You also want an ePaper? Increase the reach of your titles
YUMPU automatically turns print PDFs into web optimized ePapers that Google loves.
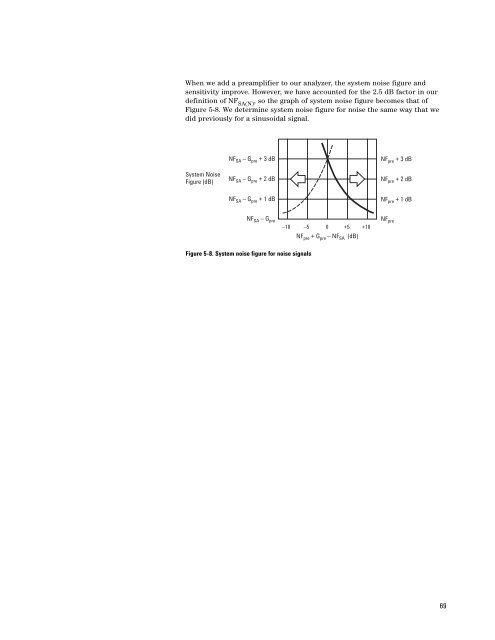
When we add a preamplifier to our analyzer, the system noise figure and<br />
sensitivity improve. However, we have accounted for the 2.5 dB factor in our<br />
definition of NF SA(N) , so the graph of system noise figure becomes that of<br />
Figure 5-8. We determine system noise figure for noise the same way that we<br />
did previously for a sinusoidal signal.<br />
System Noise<br />
Figure (dB)<br />
NF SA – G pre + 3 dB<br />
NF SA – G pre + 2 dB<br />
NF pre + 3 dB<br />
NF pre + 2 dB<br />
NF SA – G pre + 1 dB<br />
NF pre + 1 dB<br />
NF SA – G pre<br />
–10 –5 0 +5 +10<br />
NF pre + G pre – NF SA (dB)<br />
NF pre<br />
Figure 5-8. System noise figure for noise signals<br />
69


