

Agilent Spectrum Analysis Basics - Agilent Technologies
Agilent Spectrum Analysis Basics - Agilent Technologies
Agilent Spectrum Analysis Basics - Agilent Technologies

Create successful ePaper yourself
Turn your PDF publications into a flip-book with our unique Google optimized e-Paper software.
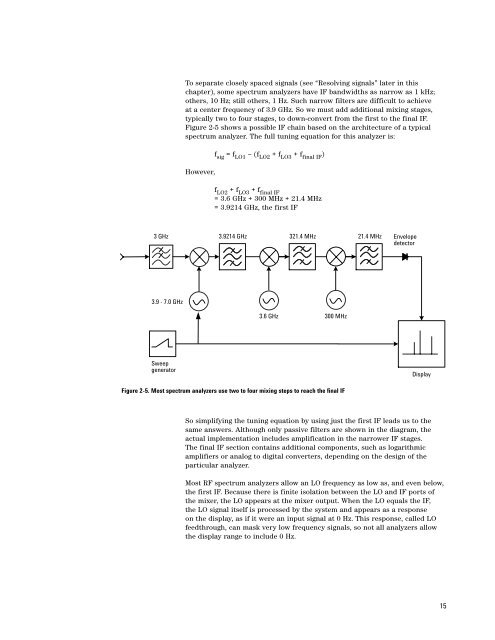
To separate closely spaced signals (see “Resolving signals” later in this<br />
chapter), some spectrum analyzers have IF bandwidths as narrow as 1 kHz;<br />
others, 10 Hz; still others, 1 Hz. Such narrow filters are difficult to achieve<br />
at a center frequency of 3.9 GHz. So we must add additional mixing stages,<br />
typically two to four stages, to down-convert from the first to the final IF.<br />
Figure 2-5 shows a possible IF chain based on the architecture of a typical<br />
spectrum analyzer. The full tuning equation for this analyzer is:<br />
However,<br />
f sig = f LO1 – (f LO2 + f LO3 + f final IF )<br />
f LO2 + f LO3 + f final IF<br />
= 3.6 GHz + 300 MHz + 21.4 MHz<br />
= 3.9214 GHz, the first IF<br />
3 GHz<br />
3.9214 GHz 321.4 MHz<br />
21.4 MHz Envelope<br />
detector<br />
3.9 - 7.0 GHz<br />
3.6 GHz<br />
300 MHz<br />
Sweep<br />
generator<br />
Display<br />
Figure 2-5. Most spectrum analyzers use two to four mixing steps to reach the final IF<br />
So simplifying the tuning equation by using just the first IF leads us to the<br />
same answers. Although only passive filters are shown in the diagram, the<br />
actual implementation includes amplification in the narrower IF stages.<br />
The final IF section contains additional components, such as logarithmic<br />
amplifiers or analog to digital converters, depending on the design of the<br />
particular analyzer.<br />
Most RF spectrum analyzers allow an LO frequency as low as, and even below,<br />
the first IF. Because there is finite isolation between the LO and IF ports of<br />
the mixer, the LO appears at the mixer output. When the LO equals the IF,<br />
the LO signal itself is processed by the system and appears as a response<br />
on the display, as if it were an input signal at 0 Hz. This response, called LO<br />
feedthrough, can mask very low frequency signals, so not all analyzers allow<br />
the display range to include 0 Hz.<br />
15


