

Agilent Spectrum Analysis Basics - Agilent Technologies
Agilent Spectrum Analysis Basics - Agilent Technologies
Agilent Spectrum Analysis Basics - Agilent Technologies

You also want an ePaper? Increase the reach of your titles
YUMPU automatically turns print PDFs into web optimized ePapers that Google loves.
Some measurements require that we preserve complete information about the<br />
signal - frequency, amplitude and phase. This type of signal analysis is called<br />
vector signal analysis, which is discussed in Application Note 150-15, Vector<br />
Signal <strong>Analysis</strong> <strong>Basics</strong>. Modern spectrum analyzers are capable of performing<br />
a wide variety of vector signal measurements. However, another large group of<br />
measurements can be made without knowing the phase relationships among<br />
the sinusoidal components. This type of signal analysis is called spectrum<br />
analysis. Because spectrum analysis is simpler to understand, yet extremely<br />
useful, we will begin this application note by looking first at how spectrum<br />
analyzers perform spectrum analysis measurements, starting in Chapter 2.<br />
Theoretically, to make the transformation from the time domain to the frequency<br />
domain, the signal must be evaluated over all time, that is, over ± infinity.<br />
However, in practice, we always use a finite time period when making a<br />
measurement. Fourier transformations can also be made from the frequency<br />
to the time domain. This case also theoretically requires the evaluation of<br />
all spectral components over frequencies to ± infinity. In reality, making<br />
measurements in a finite bandwidth that captures most of the signal energy<br />
produces acceptable results. When performing a Fourier transformation on<br />
frequency domain data, the phase of the individual components is indeed<br />
critical. For example, a square wave transformed to the frequency domain<br />
and back again could turn into a sawtooth wave if phase were not preserved.<br />
What is a spectrum?<br />
So what is a spectrum in the context of this discussion? A spectrum is a<br />
collection of sine waves that, when combined properly, produce the<br />
time-domain signal under examination. Figure 1-1 shows the waveform of a<br />
complex signal. Suppose that we were hoping to see a sine wave. Although<br />
the waveform certainly shows us that the signal is not a pure sinusoid, it<br />
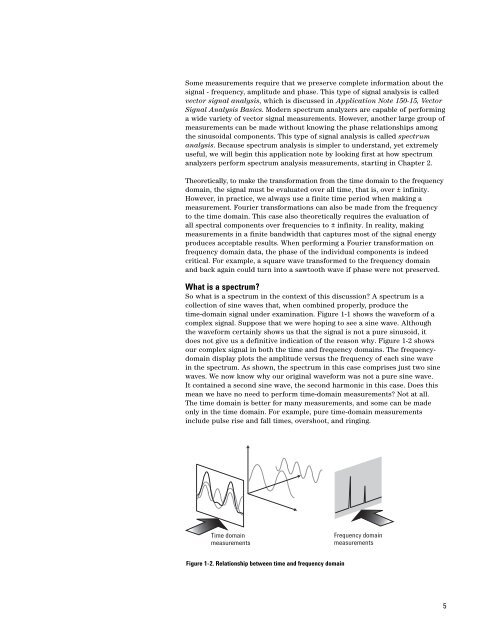
does not give us a definitive indication of the reason why. Figure 1-2 shows<br />
our complex signal in both the time and frequency domains. The frequencydomain<br />
display plots the amplitude versus the frequency of each sine wave<br />
in the spectrum. As shown, the spectrum in this case comprises just two sine<br />
waves. We now know why our original waveform was not a pure sine wave.<br />
It contained a second sine wave, the second harmonic in this case. Does this<br />
mean we have no need to perform time-domain measurements? Not at all.<br />
The time domain is better for many measurements, and some can be made<br />
only in the time domain. For example, pure time-domain measurements<br />
include pulse rise and fall times, overshoot, and ringing.<br />
Time domain<br />
measurements<br />
Frequency domain<br />
measurements<br />
Figure 1-2. Relationship between time and frequency domain<br />
5


