

Agilent Spectrum Analysis Basics - Agilent Technologies
Agilent Spectrum Analysis Basics - Agilent Technologies
Agilent Spectrum Analysis Basics - Agilent Technologies

You also want an ePaper? Increase the reach of your titles
YUMPU automatically turns print PDFs into web optimized ePapers that Google loves.
Detector types<br />
With digital displays, we had to decide what value should be displayed for<br />
each display data point. No matter how many data points we use across<br />
the display, each point must represent what has occurred over some<br />
frequency range and, although we usually do not think in terms of time<br />
when dealing with a spectrum analyzer, over some time interval.<br />
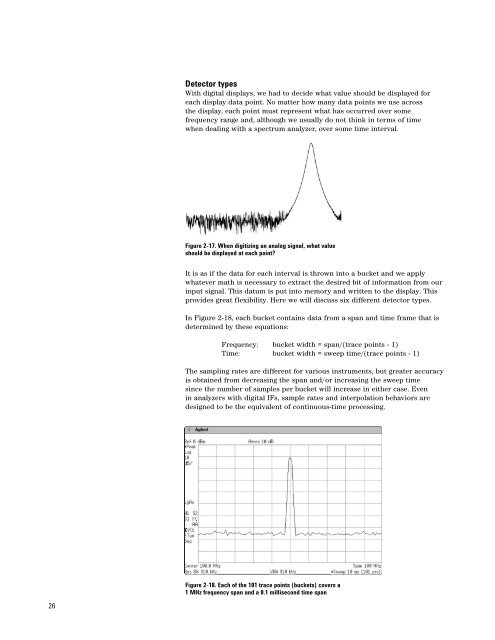
Figure 2-17. When digitizing an analog signal, what value<br />
should be displayed at each point?<br />
It is as if the data for each interval is thrown into a bucket and we apply<br />
whatever math is necessary to extract the desired bit of information from our<br />
input signal. This datum is put into memory and written to the display. This<br />
provides great flexibility. Here we will discuss six different detector types.<br />
In Figure 2-18, each bucket contains data from a span and time frame that is<br />
determined by these equations:<br />
Frequency: bucket width = span/(trace points - 1)<br />
Time: bucket width = sweep time/(trace points - 1)<br />
The sampling rates are different for various instruments, but greater accuracy<br />
is obtained from decreasing the span and/or increasing the sweep time<br />
since the number of samples per bucket will increase in either case. Even<br />
in analyzers with digital IFs, sample rates and interpolation behaviors are<br />
designed to be the equivalent of continuous-time processing.<br />
Figure 2-18. Each of the 101 trace points (buckets) covers a<br />
1 MHz frequency span and a 0.1 millisecond time span<br />
26


