

Agilent Spectrum Analysis Basics - Agilent Technologies
Agilent Spectrum Analysis Basics - Agilent Technologies
Agilent Spectrum Analysis Basics - Agilent Technologies

You also want an ePaper? Increase the reach of your titles
YUMPU automatically turns print PDFs into web optimized ePapers that Google loves.
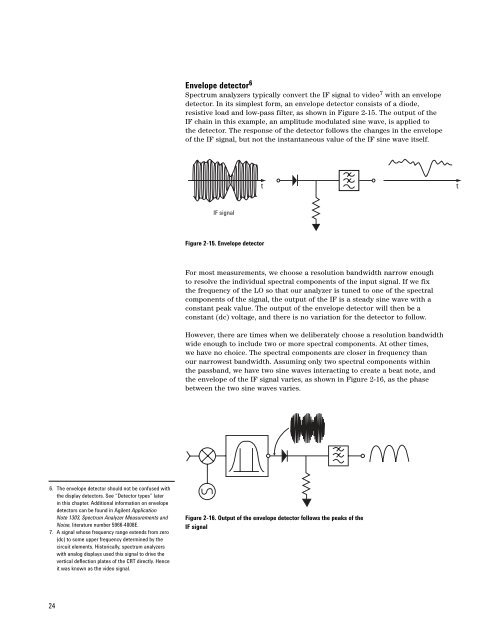
Envelope detector 6<br />
<strong>Spectrum</strong> analyzers typically convert the IF signal to video 7 with an envelope<br />
detector. In its simplest form, an envelope detector consists of a diode,<br />
resistive load and low-pass filter, as shown in Figure 2-15. The output of the<br />
IF chain in this example, an amplitude modulated sine wave, is applied to<br />
the detector. The response of the detector follows the changes in the envelope<br />
of the IF signal, but not the instantaneous value of the IF sine wave itself.<br />
t<br />
t<br />
IF signal<br />
Figure 2-15. Envelope detector<br />
For most measurements, we choose a resolution bandwidth narrow enough<br />
to resolve the individual spectral components of the input signal. If we fix<br />
the frequency of the LO so that our analyzer is tuned to one of the spectral<br />
components of the signal, the output of the IF is a steady sine wave with a<br />
constant peak value. The output of the envelope detector will then be a<br />
constant (dc) voltage, and there is no variation for the detector to follow.<br />
However, there are times when we deliberately choose a resolution bandwidth<br />
wide enough to include two or more spectral components. At other times,<br />
we have no choice. The spectral components are closer in frequency than<br />
our narrowest bandwidth. Assuming only two spectral components within<br />
the passband, we have two sine waves interacting to create a beat note, and<br />
the envelope of the IF signal varies, as shown in Figure 2-16, as the phase<br />
between the two sine waves varies.<br />
6. The envelope detector should not be confused with<br />
the display detectors. See “Detector types” later<br />
in this chapter. Additional information on envelope<br />
detectors can be found in <strong>Agilent</strong> Application<br />
Note 1303, <strong>Spectrum</strong> Analyzer Measurements and<br />
Noise, literature number 5966-4008E.<br />
7. A signal whose frequency range extends from zero<br />
(dc) to some upper frequency determined by the<br />
circuit elements. Historically, spectrum analyzers<br />
with analog displays used this signal to drive the<br />
vertical deflection plates of the CRT directly. Hence<br />
it was known as the video signal.<br />
Figure 2-16. Output of the envelope detector follows the peaks of the<br />
IF signal<br />
24


