

Agilent Spectrum Analysis Basics - Agilent Technologies
Agilent Spectrum Analysis Basics - Agilent Technologies
Agilent Spectrum Analysis Basics - Agilent Technologies

You also want an ePaper? Increase the reach of your titles
YUMPU automatically turns print PDFs into web optimized ePapers that Google loves.
While we have defined spectrum analysis and vector signal analysis as<br />
distinct types, digital technology and digital signal processing are blurring<br />
that distinction. The critical factor is where the signal is digitized. Early<br />
on, when digitizers were limited to a few tens of kilohertz, only the video<br />
(baseband) signal of a spectrum analyzer was digitized. Since the video signal<br />
carried no phase information, only magnitude data could be displayed.<br />
But even this limited use of digital technology yielded significant advances:<br />
flicker-free displays of slow sweeps, display markers, different types of<br />
averaging, and data output to computers and printers.<br />
Because the signals that people must analyze are becoming more complex, the<br />
latest generations of spectrum analyzers include many of the vector signal<br />
analysis capabilities previously found only in Fourier and vector signal<br />
analyzers. Analyzers may digitize the signal near the instrument’s input,<br />
after some amplification, or after one or more downconverter stages. In any<br />
of these cases, relative phase as well as magnitude is preserved. In addition to<br />
the benefits noted above, true vector measurements can be made. Capabilities<br />
are then determined by the digital signal processing capability inherent in the<br />
analyzer’s firmware or available as add-on software running either internally<br />
(measurement personalities) or externally (vector signal analysis software)<br />
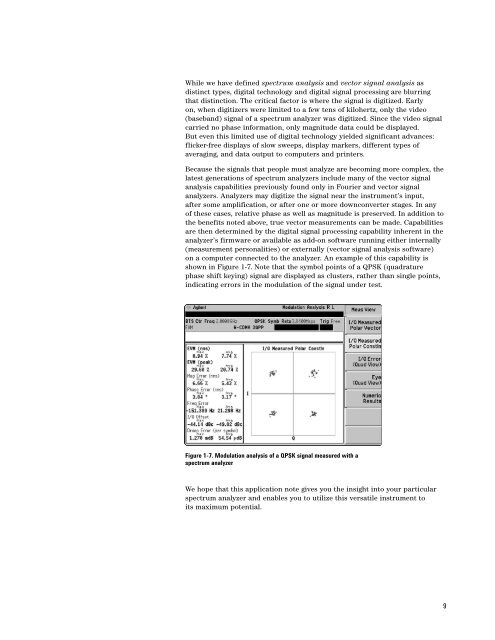
on a computer connected to the analyzer. An example of this capability is<br />
shown in Figure 1-7. Note that the symbol points of a QPSK (quadrature<br />
phase shift keying) signal are displayed as clusters, rather than single points,<br />
indicating errors in the modulation of the signal under test.<br />
Figure 1-7. Modulation analysis of a QPSK signal measured with a<br />
spectrum analyzer<br />
We hope that this application note gives you the insight into your particular<br />
spectrum analyzer and enables you to utilize this versatile instrument to<br />
its maximum potential.<br />
9


