

Agilent Spectrum Analysis Basics - Agilent Technologies
Agilent Spectrum Analysis Basics - Agilent Technologies
Agilent Spectrum Analysis Basics - Agilent Technologies

You also want an ePaper? Increase the reach of your titles
YUMPU automatically turns print PDFs into web optimized ePapers that Google loves.
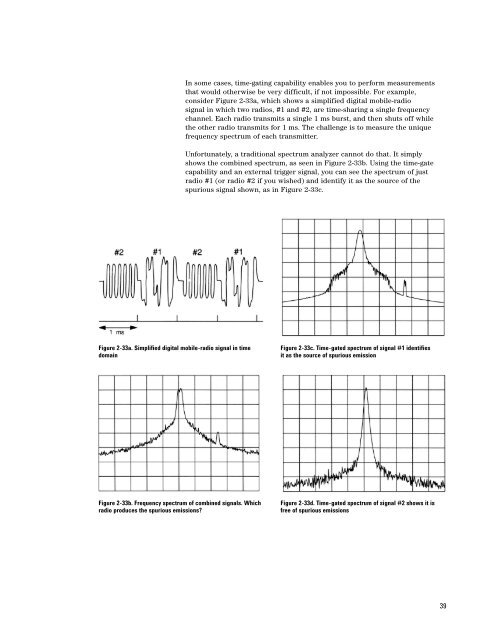
In some cases, time-gating capability enables you to perform measurements<br />
that would otherwise be very difficult, if not impossible. For example,<br />
consider Figure 2-33a, which shows a simplified digital mobile-radio<br />
signal in which two radios, #1 and #2, are time-sharing a single frequency<br />
channel. Each radio transmits a single 1 ms burst, and then shuts off while<br />
the other radio transmits for 1 ms. The challenge is to measure the unique<br />
frequency spectrum of each transmitter.<br />
Unfortunately, a traditional spectrum analyzer cannot do that. It simply<br />
shows the combined spectrum, as seen in Figure 2-33b. Using the time-gate<br />
capability and an external trigger signal, you can see the spectrum of just<br />
radio #1 (or radio #2 if you wished) and identify it as the source of the<br />
spurious signal shown, as in Figure 2-33c.<br />
Figure 2-33a. Simplified digital mobile-radio signal in time<br />
domain<br />
Figure 2-33c. Time-gated spectrum of signal #1 identifies<br />
it as the source of spurious emission<br />
Figure 2-33b. Frequency spectrum of combined signals. Which<br />
radio produces the spurious emissions?<br />
Figure 2-33d. Time-gated spectrum of signal #2 shows it is<br />
free of spurious emissions<br />
39


